Searching the Logs
You can quickly search and filter through the IguanaX Logs:
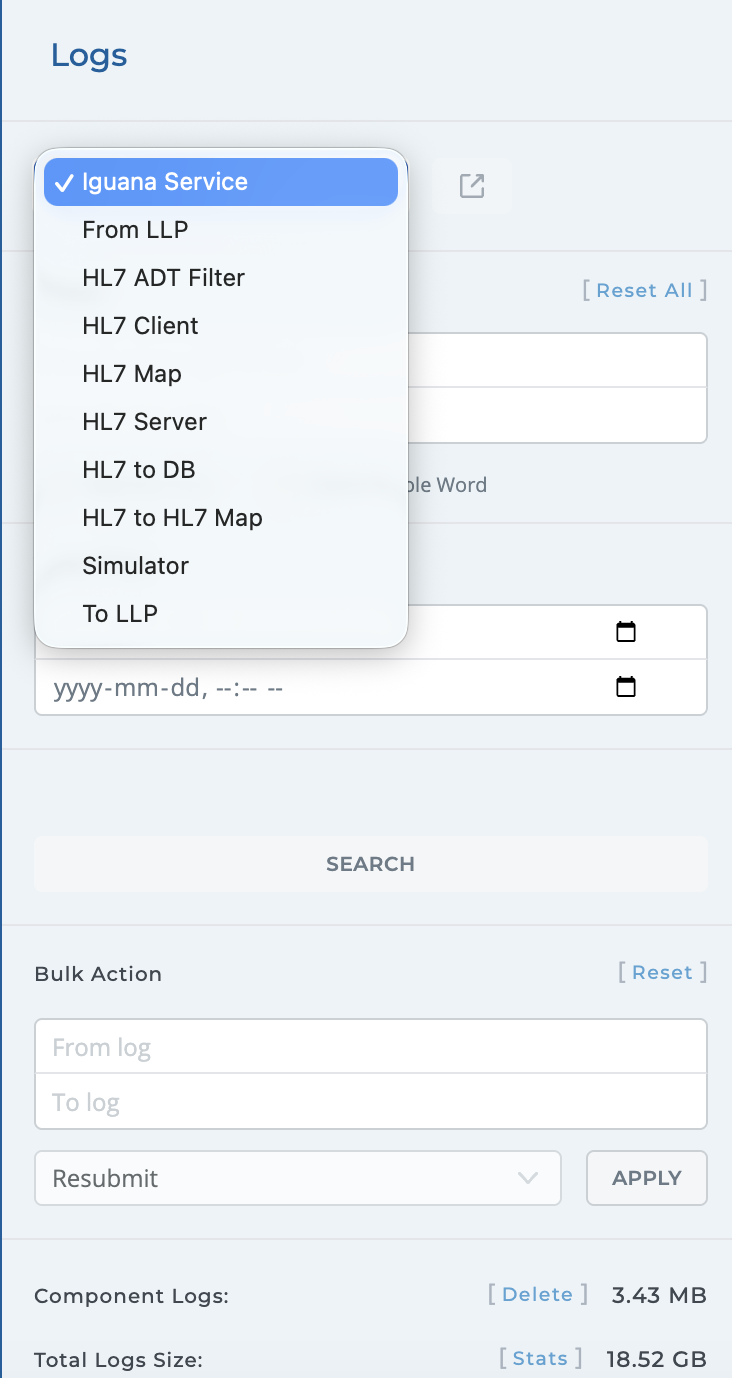
STEP 1: Select the source of the log entries
Use the Component list box to select the source of the log messages. You can filter results for a specific component or the IguanaX Service.
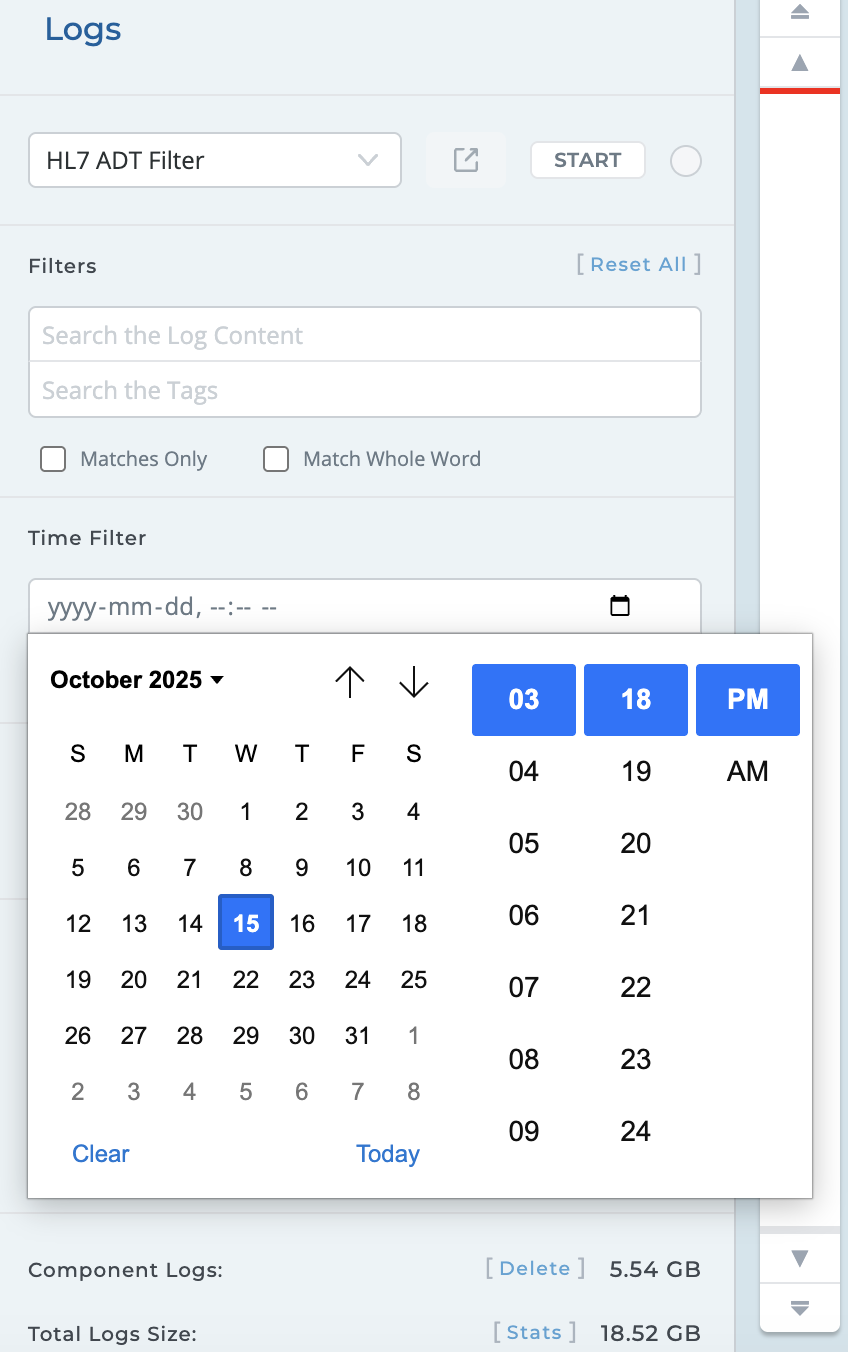
STEP 2: Select a time range
Either manually enter or use the calendar icon to select a start and end time range to filter log entry results.
STEP 3: Use plain string text or #hashtags to search the logs
You can quickly search the logs using a few different strategies:
-
Using plain character strings
-
Using #hashtags.
-
Using pattern matching techniques with glob expressions or regular expressions.
By default, the search is not case sensitive, you will get all results containing the entered characters.
Iguana's log search also supports SQL-like Boolean operators( NOT , AND , OR ). When multiple operators are used in a single query, IguanaX evaluates them in the following order (from highest precedence to lowest):
-
NOT
-
AND
-
OR
Operators are case-sensitive. For example, AND works, but and does not.
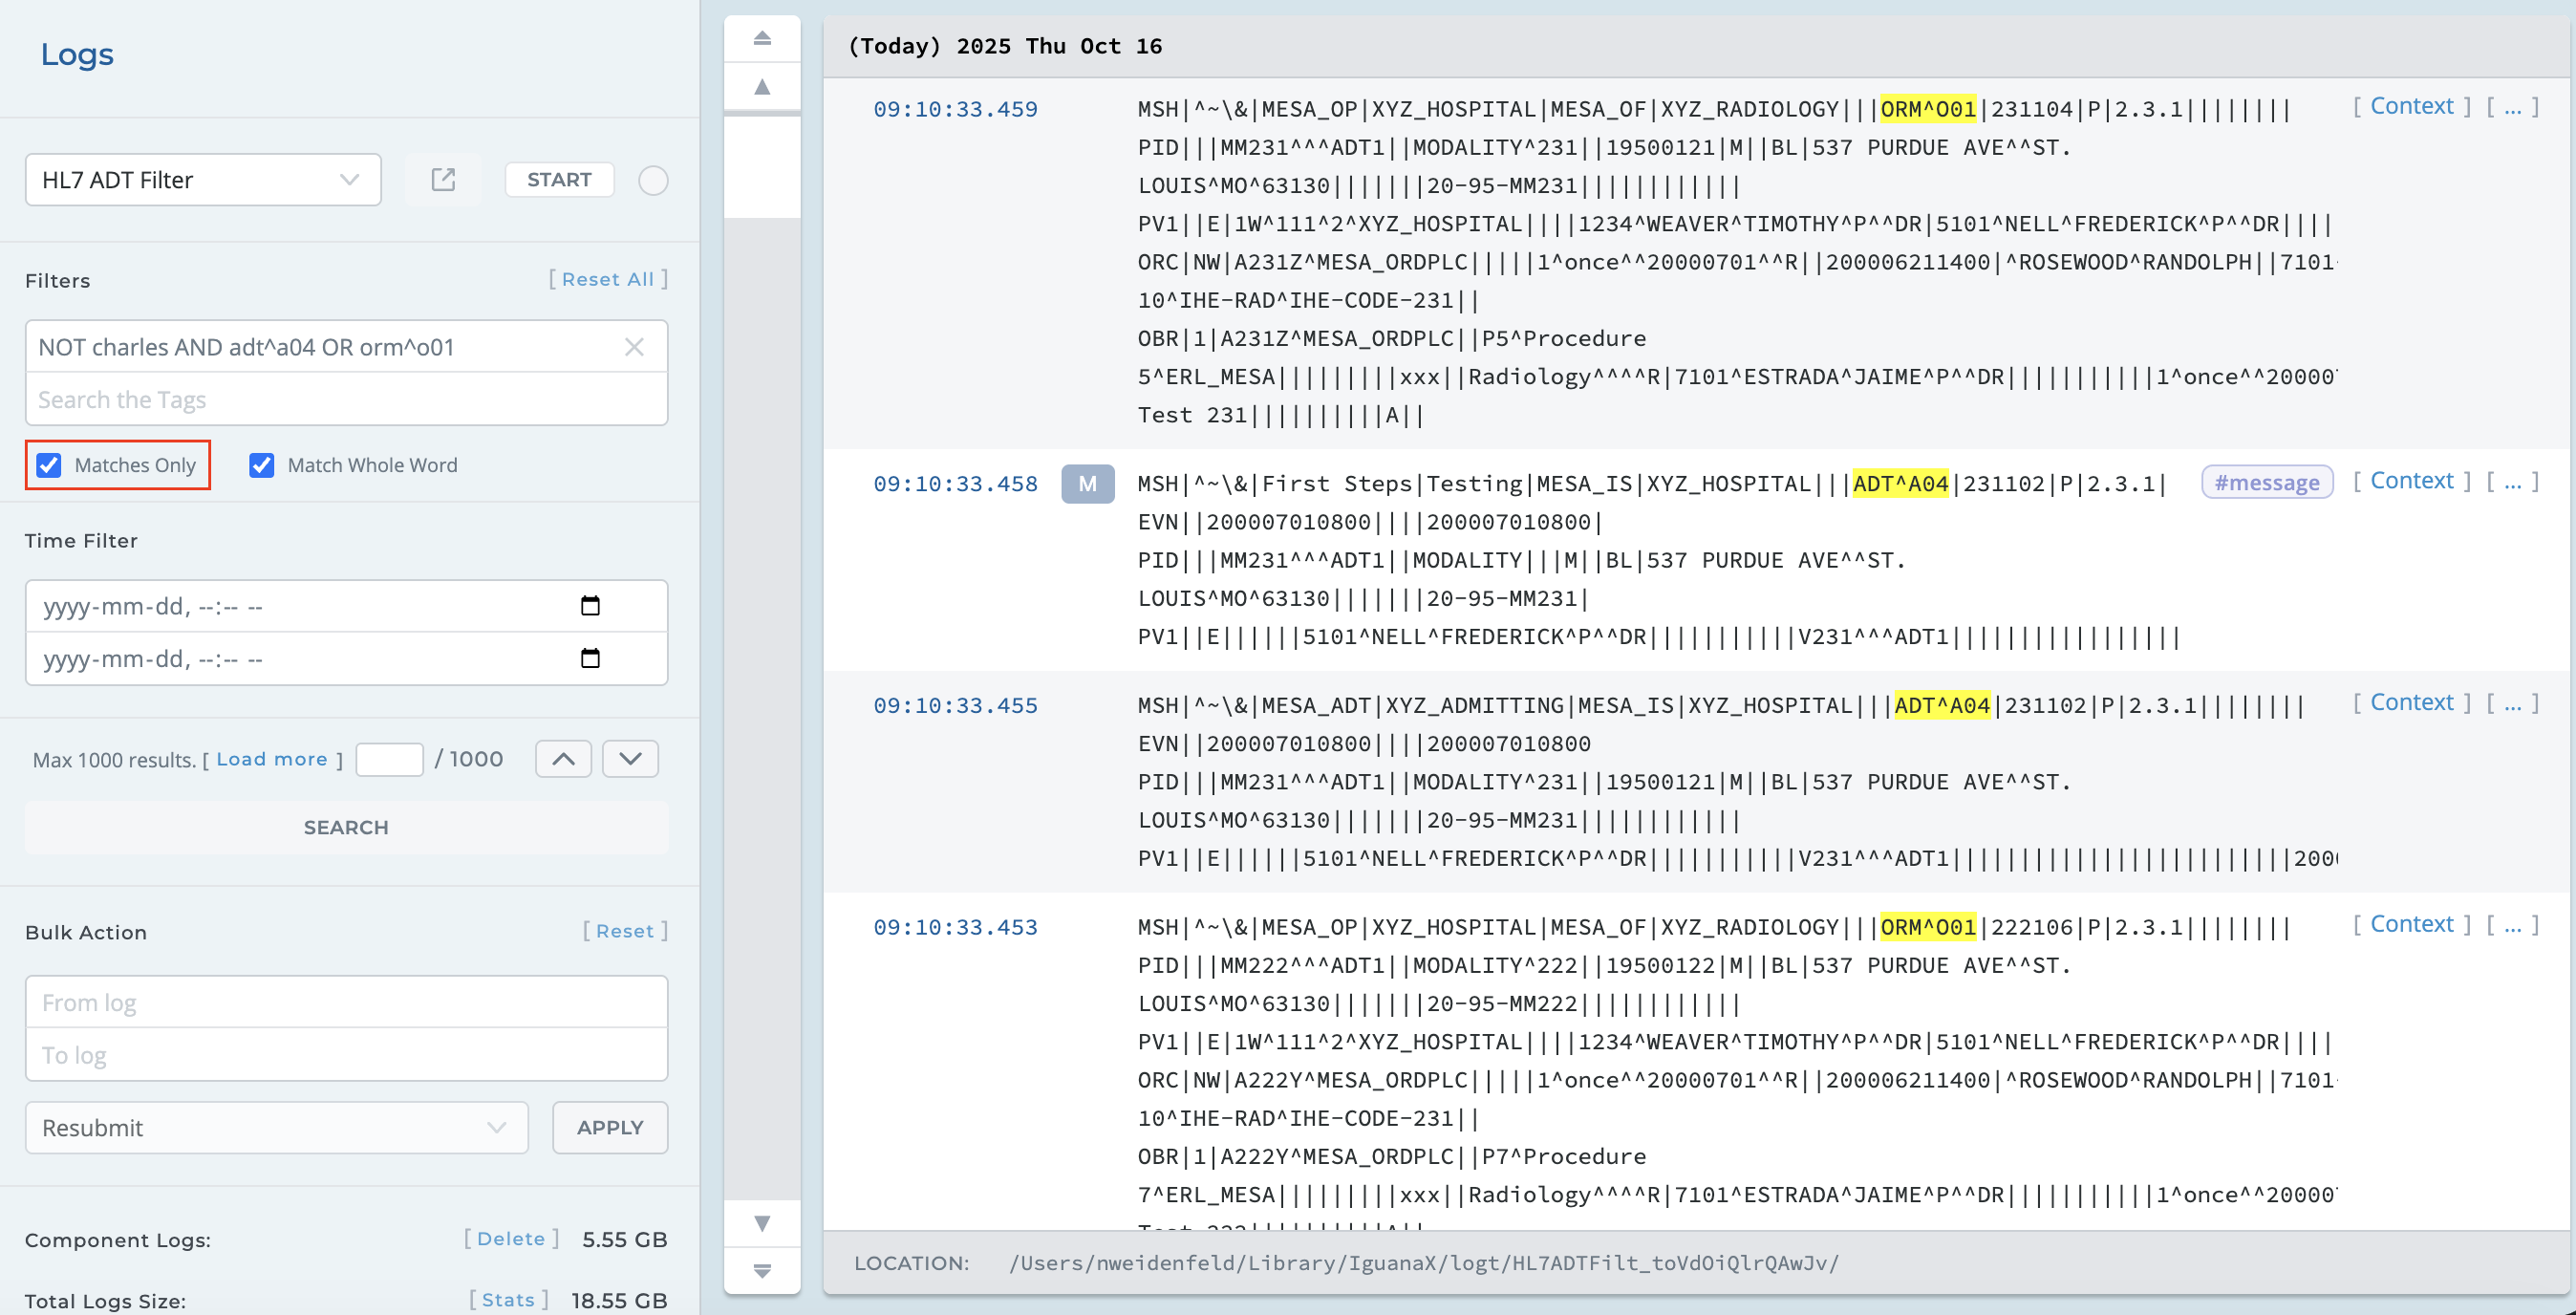
Therefore, if you wanted to search for log messages that did not include patients named “Charles”, and had a message type of ADT^A04 or ORM^O01, your search would look something like this:

The Match Whole Word option allows you to return results that match the whole word or phrase exactly as entered.
Notice that some of the log entries above are greyed out. If you select Matches Only, Iguana will display only the log entries that match the search criteria.
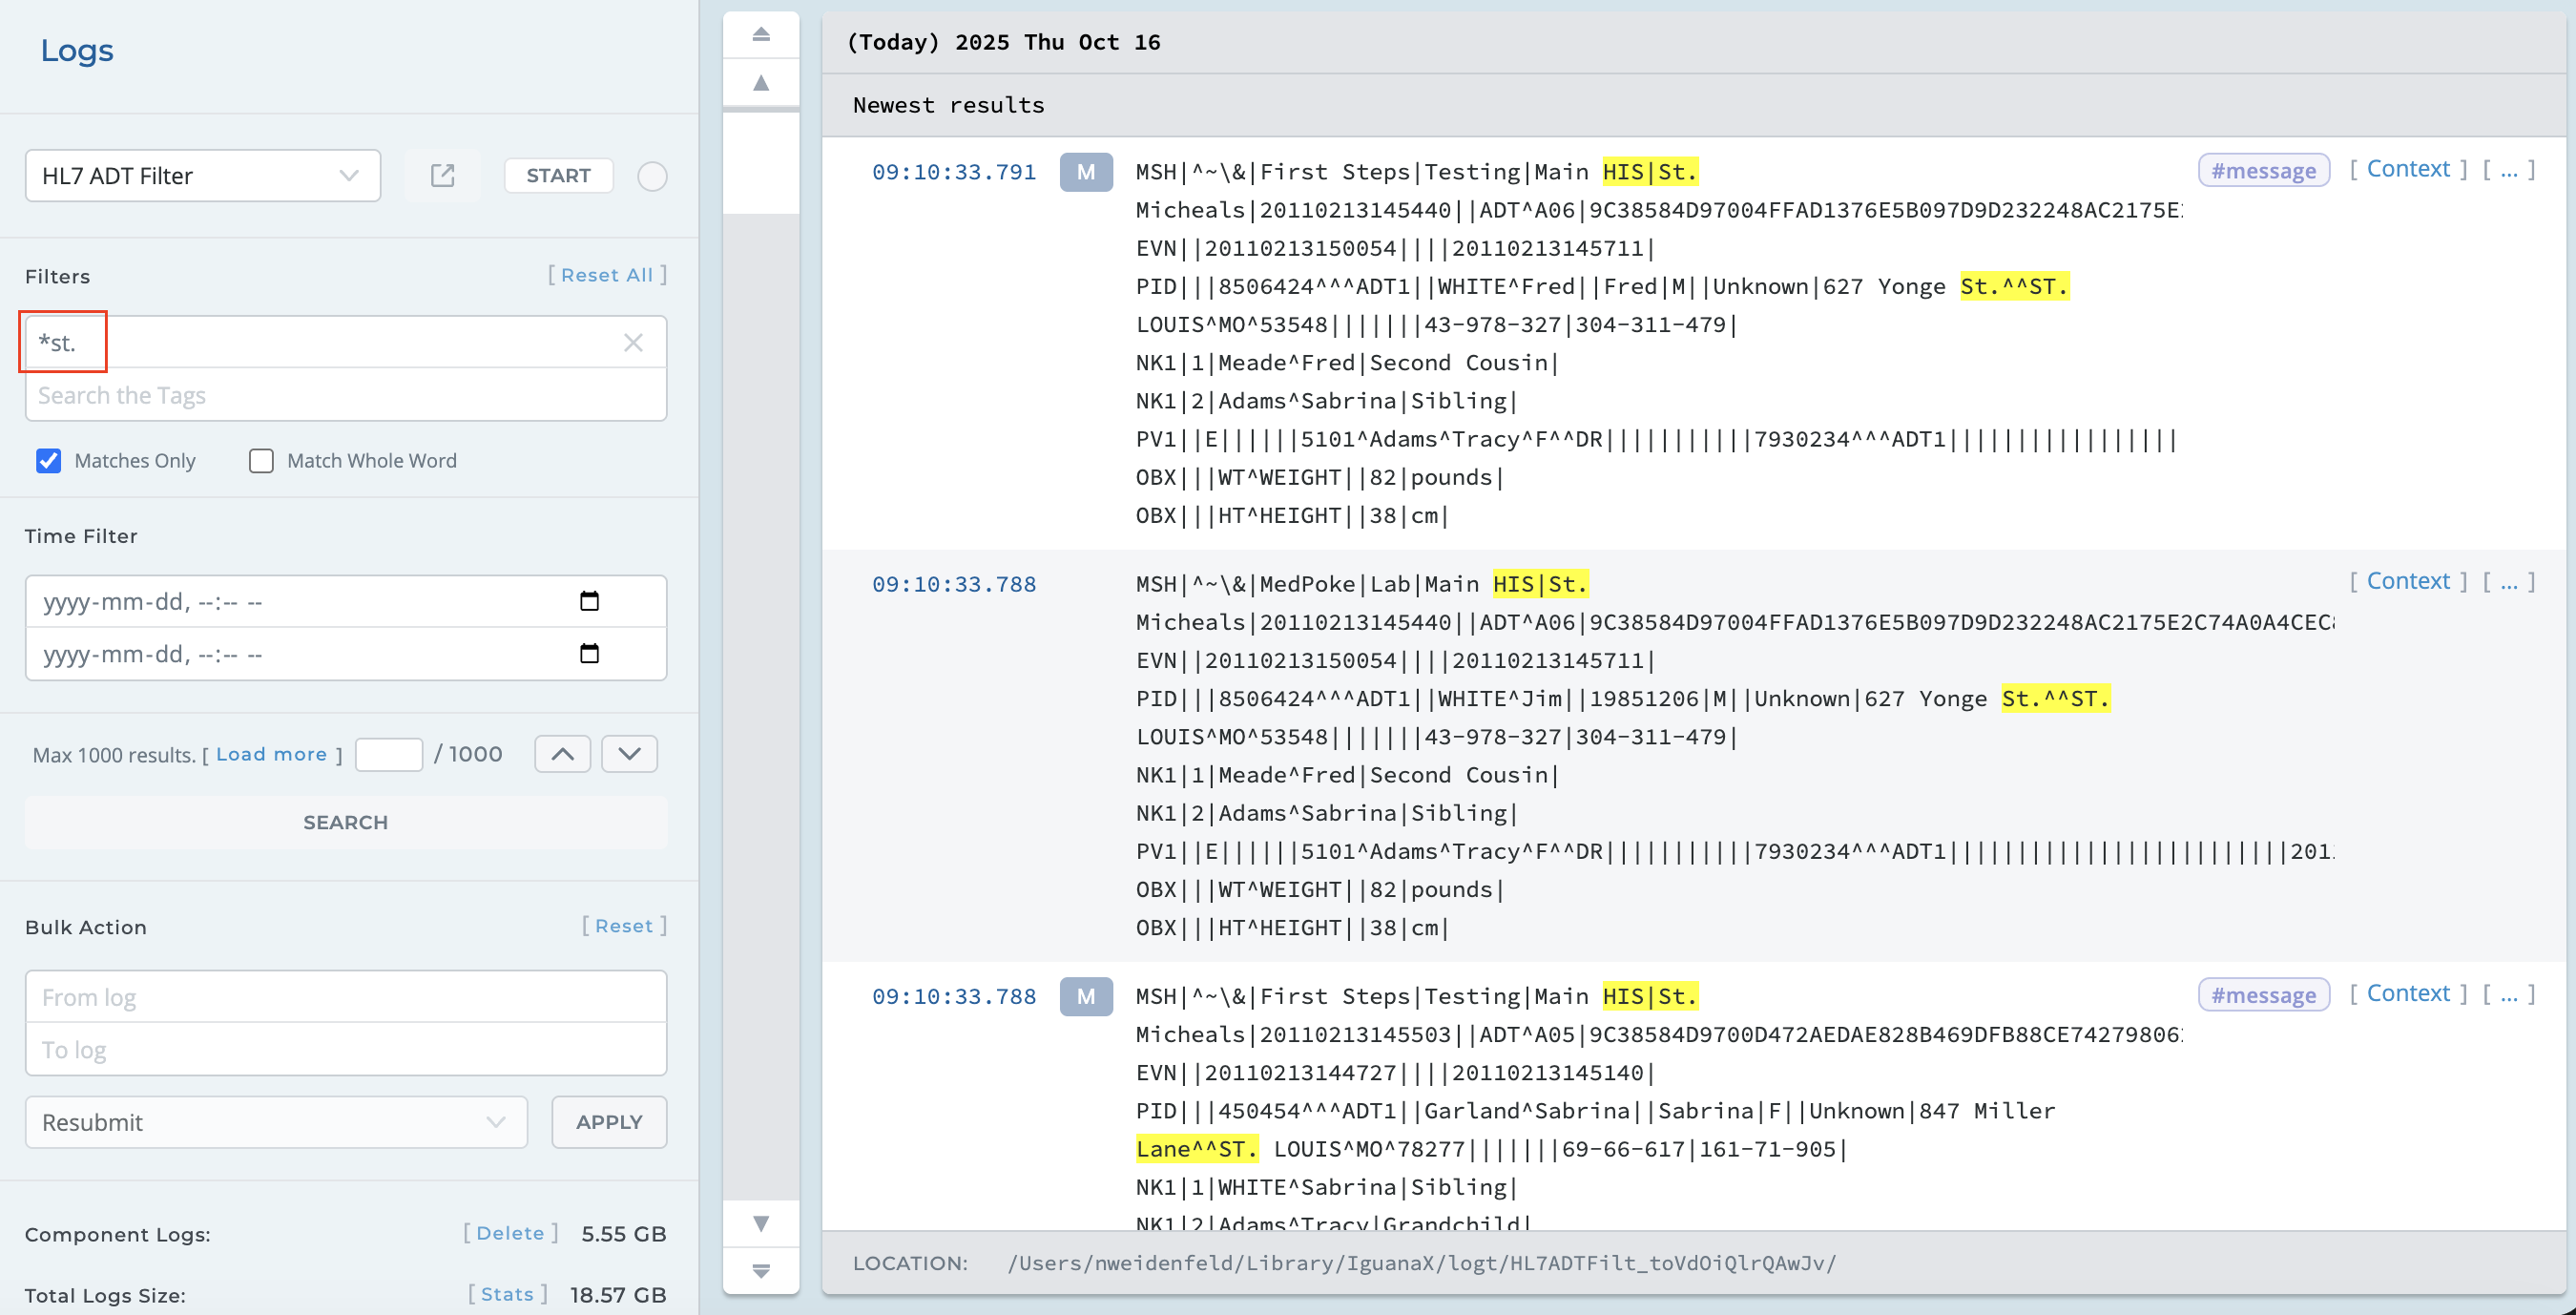
A wildcard log search using * allows you to find log entries that match a partial keyword or pattern, rather than an exact term. For example, searching for *st. will return results that include non-space characters:
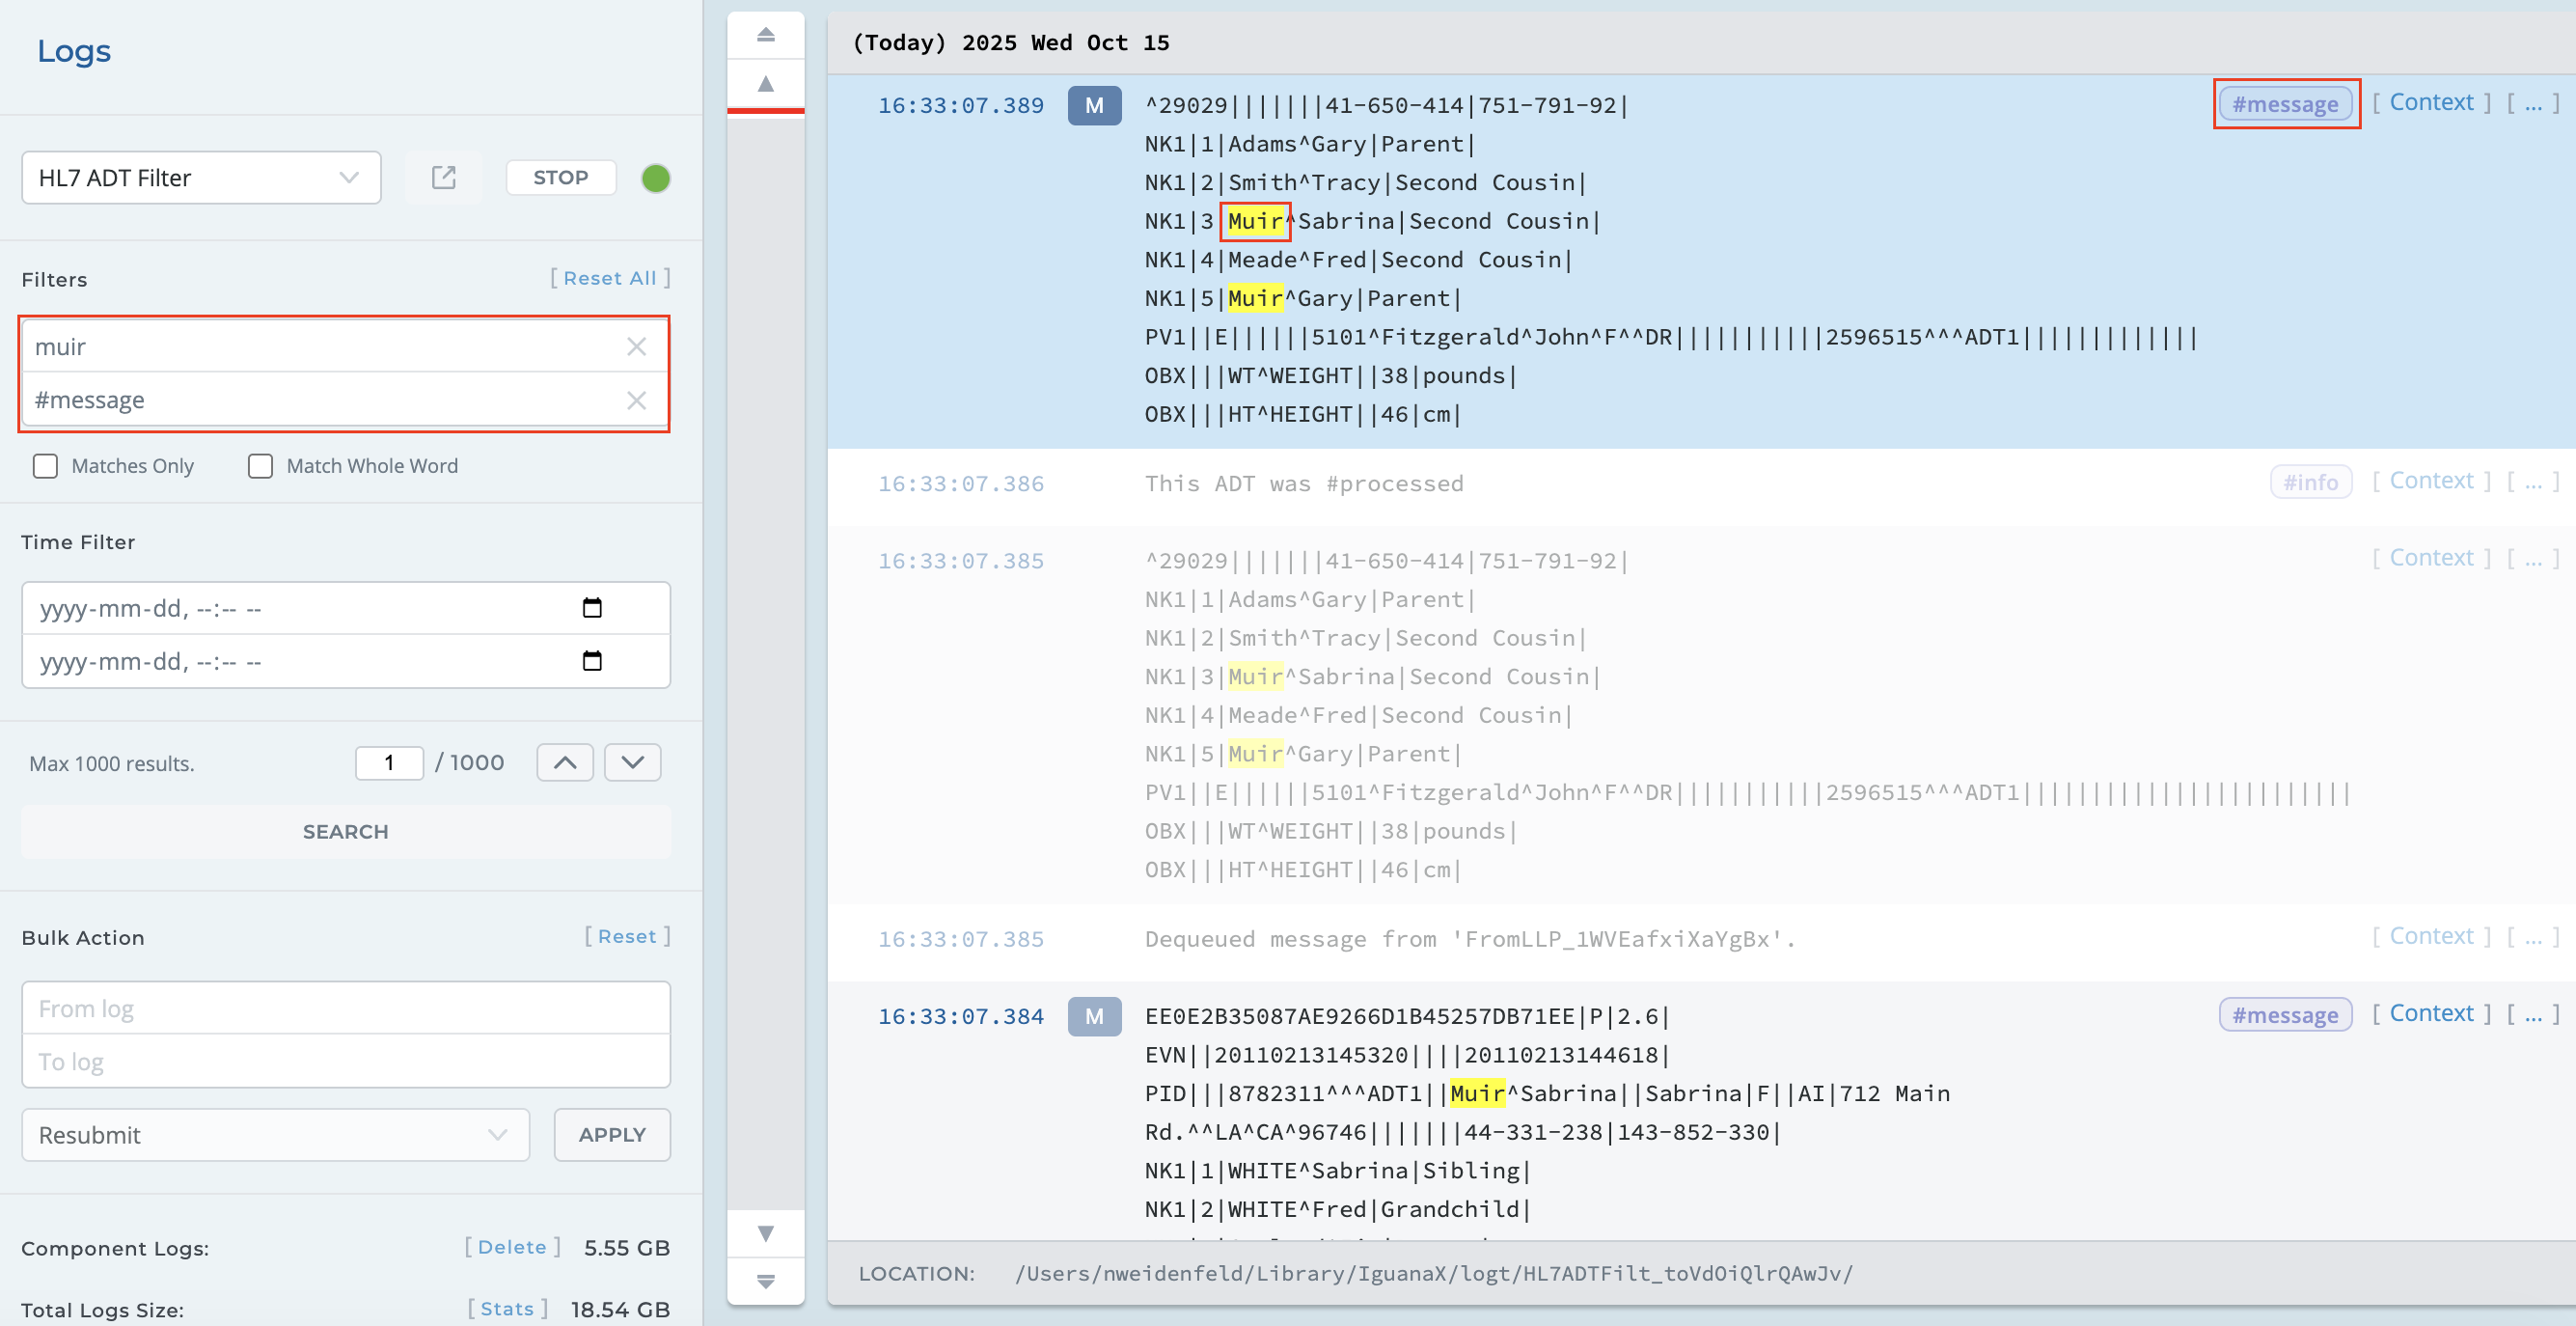
You can also search by #hashtag. Combing a plain character search with a #hashtag search will provide even more granularity.
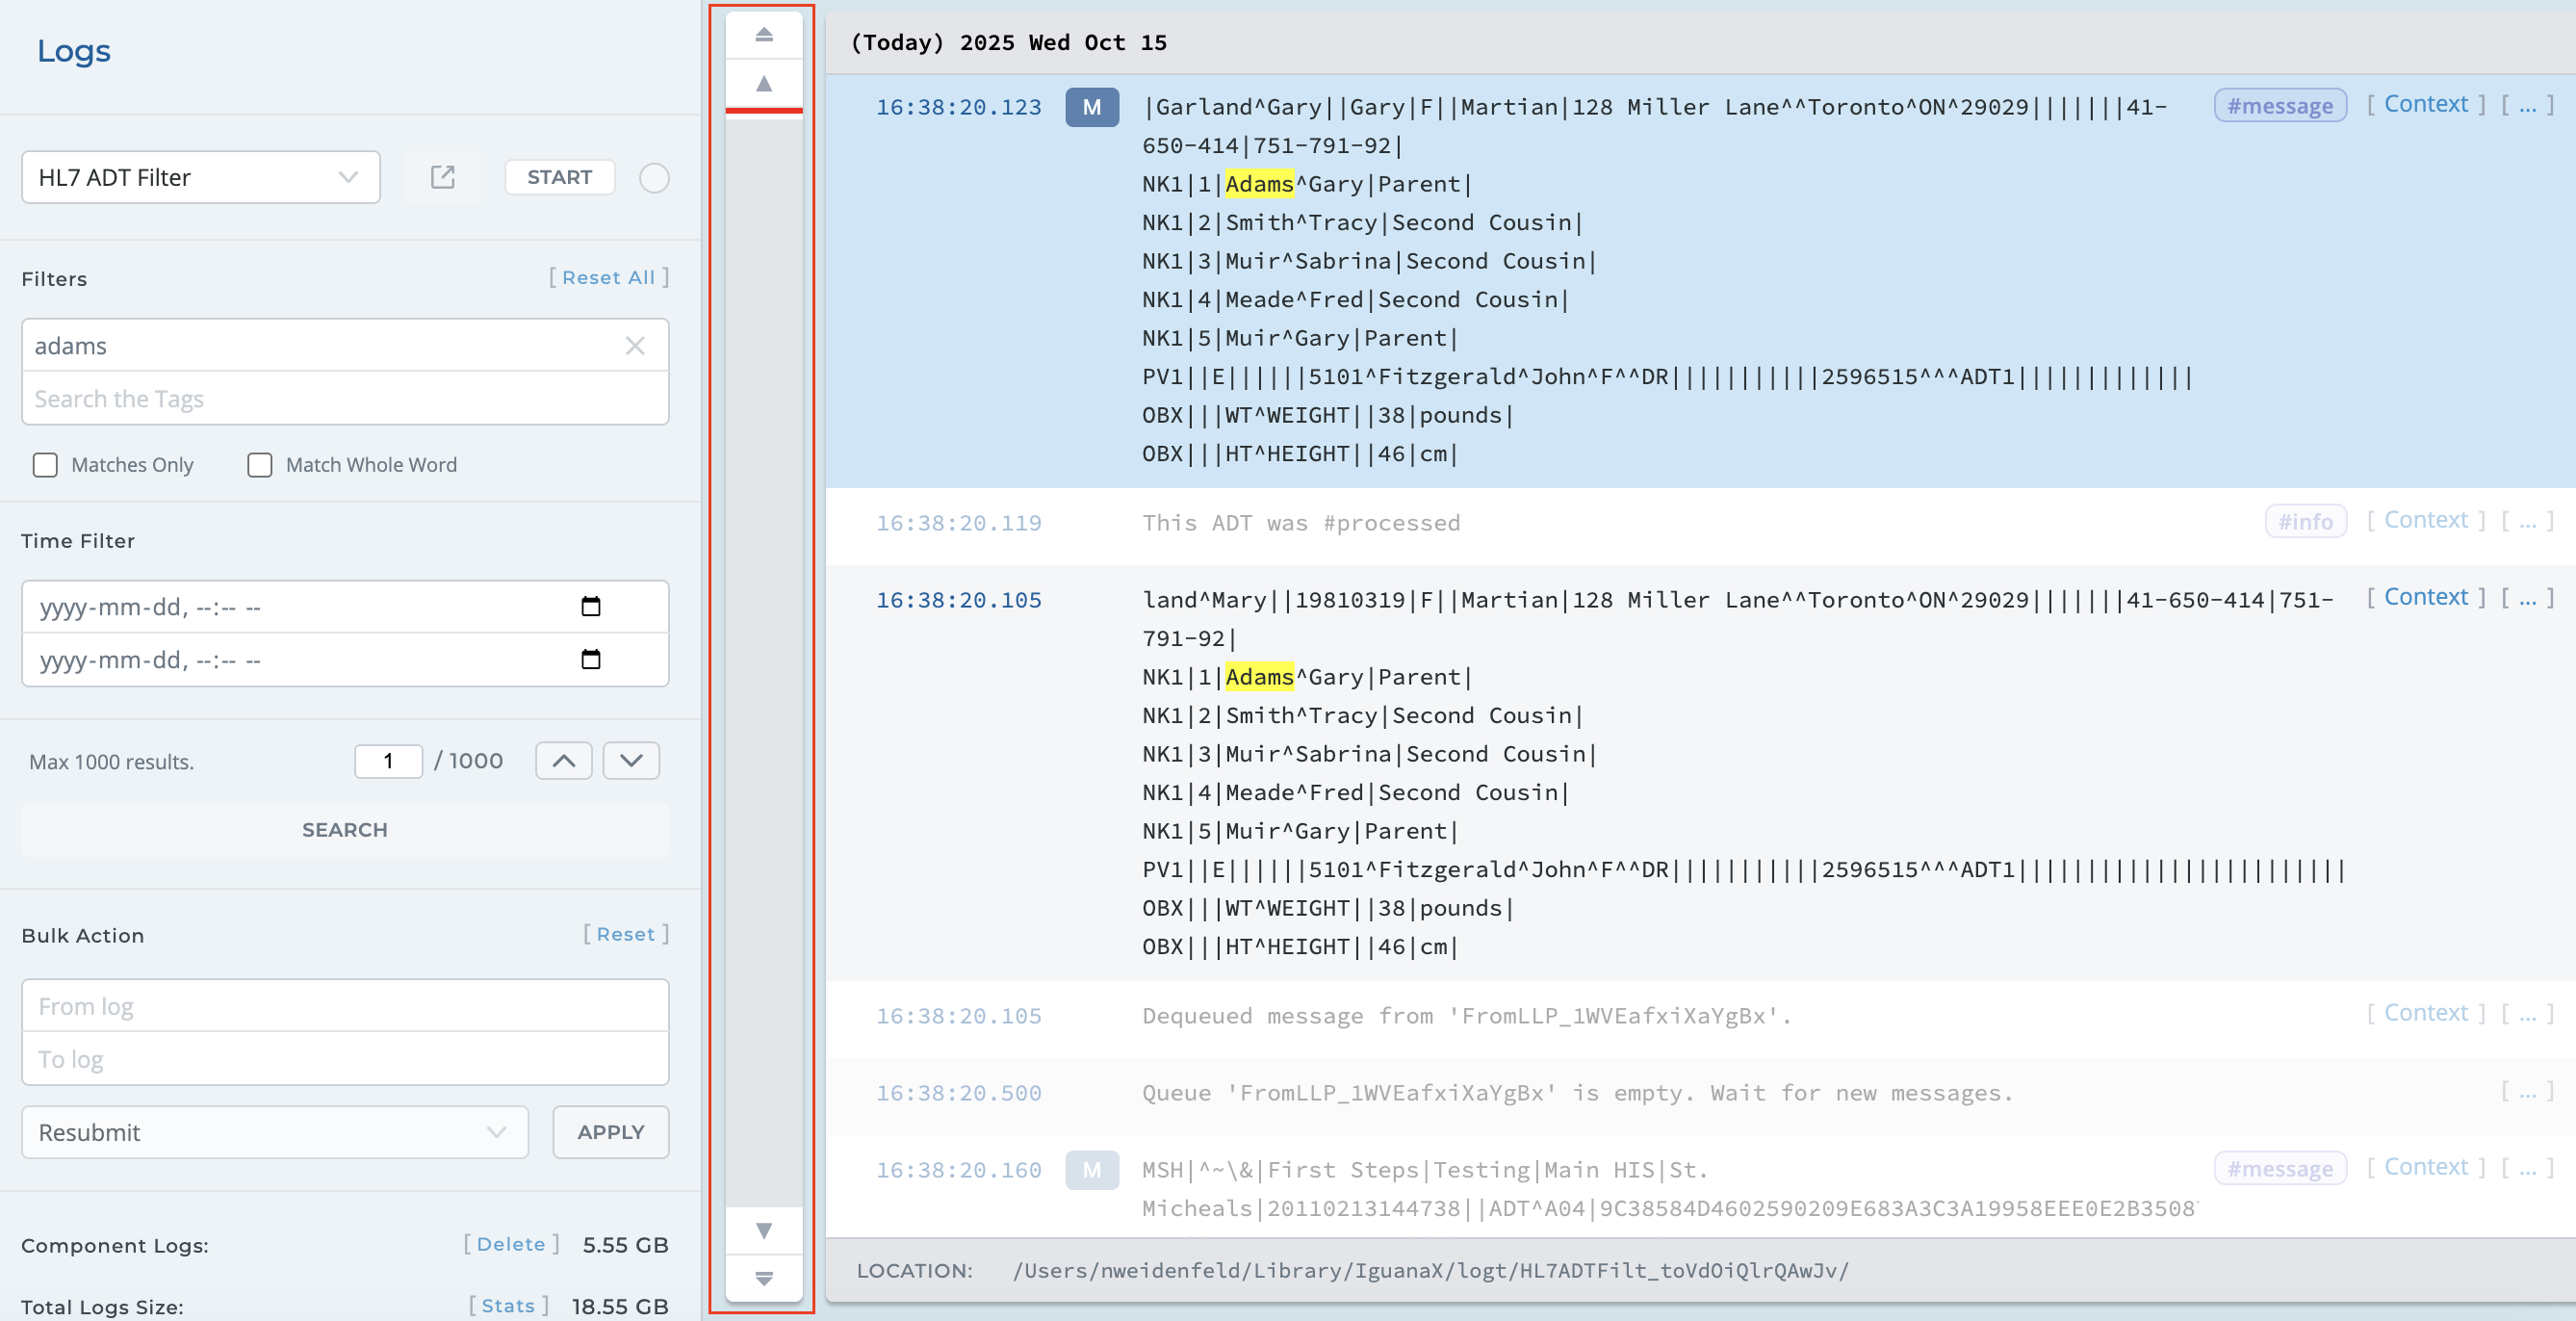
STEP 4: View log results with the navigation arrow buttons
View log entries using the navigation arrows. Use the up and down buttons to skip to the next log entry, or skip to the newest and oldest log entry result.
STEP 5: Resubmit log messages in bulk for reprocessing
If you need to reprocess large volumes of data that failed or were processed incorrectly, you can use IguanaX's bulk-resubmit feature to efficiently resubmit your logs.
In the Bulk Action section, specify the range of messages to resubmit using the From log and To log fields, then click Apply.
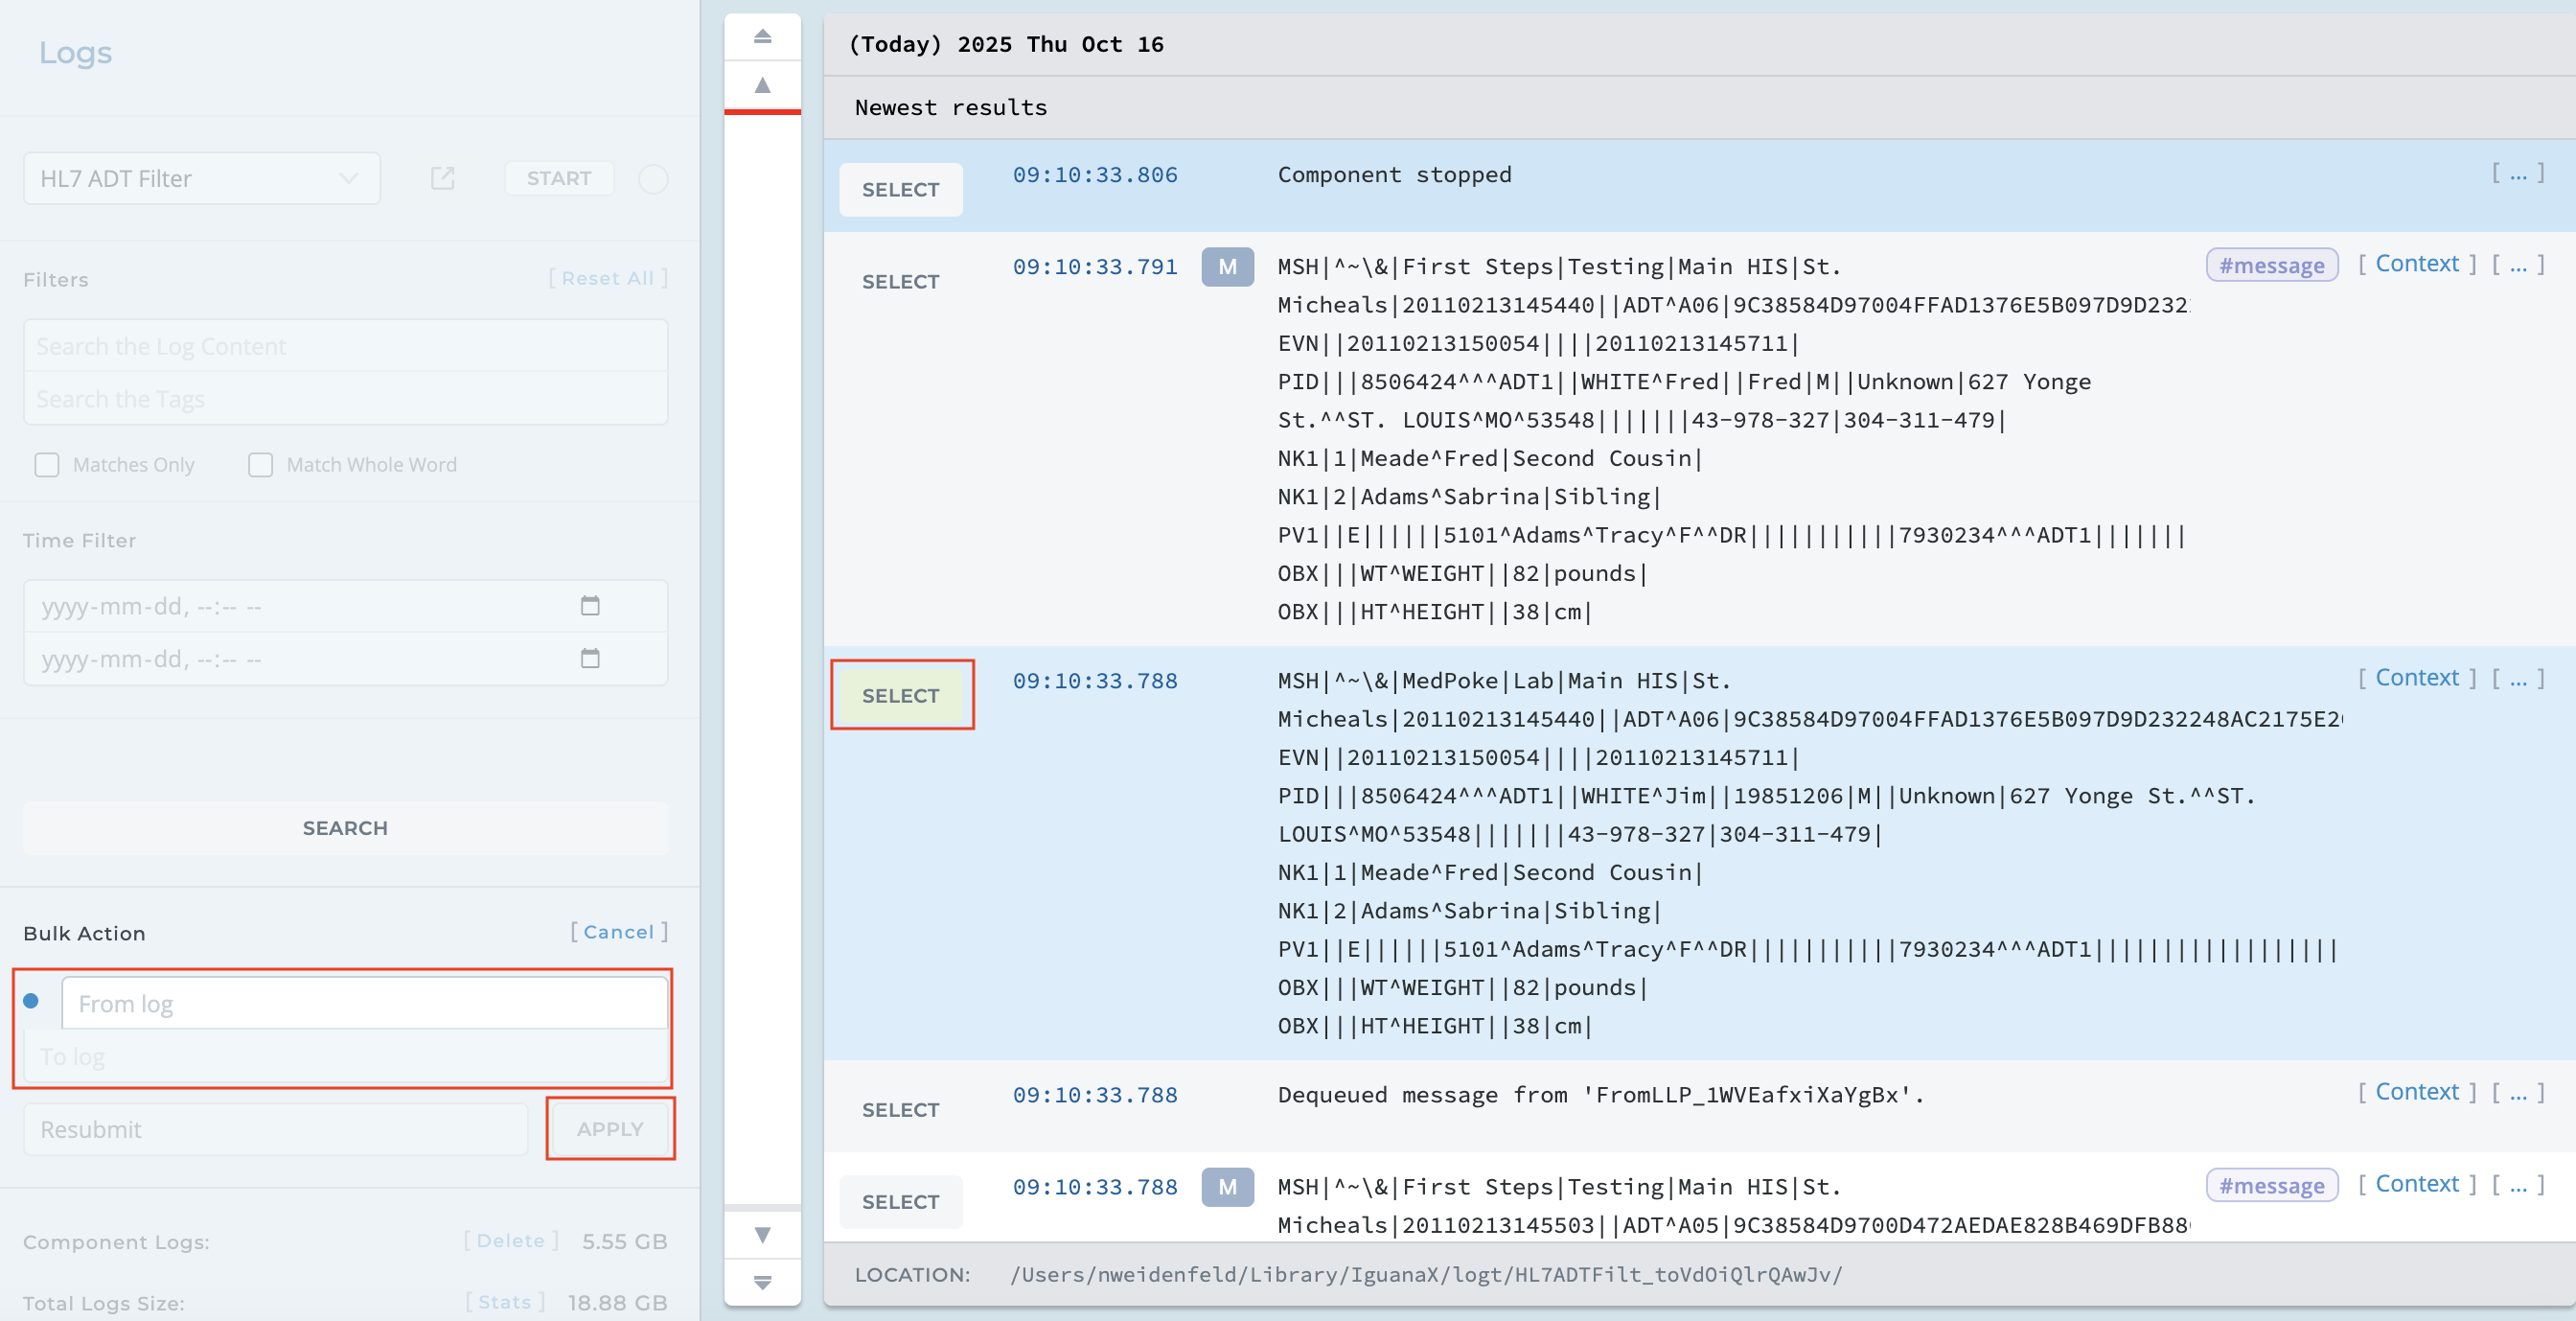
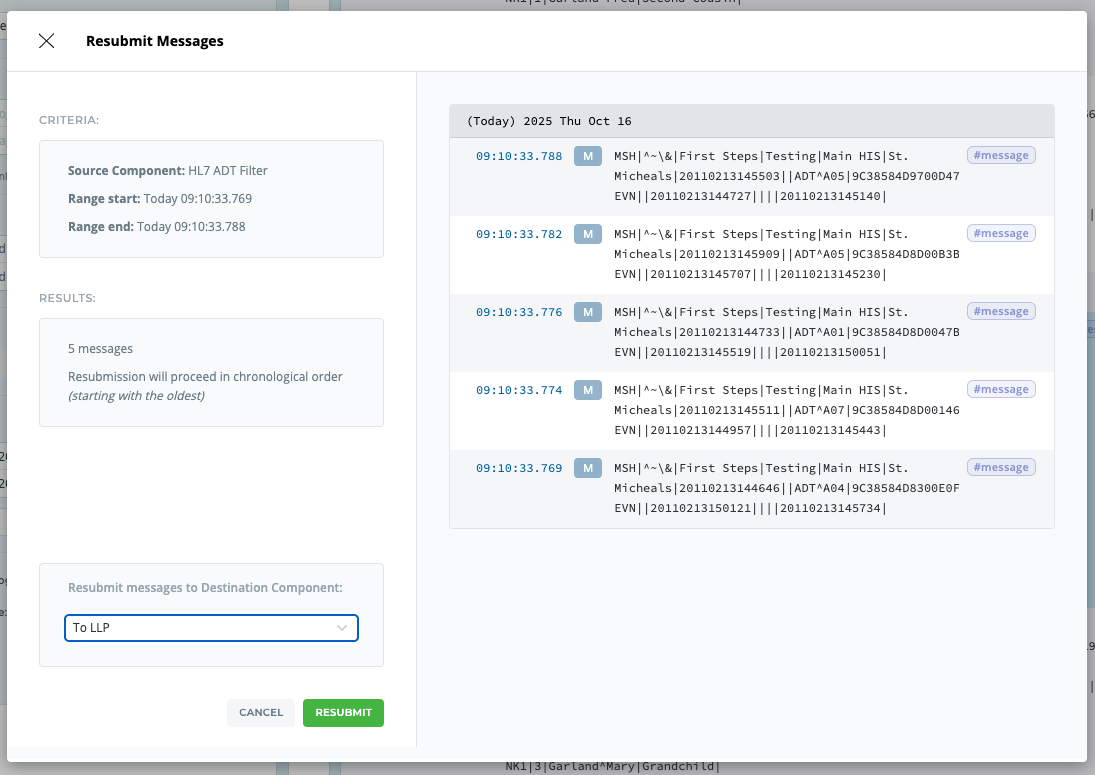
A summary pop-up will appear, allowing you to review the action and select the component to which the messages should be resent.
