Viewing Log Details
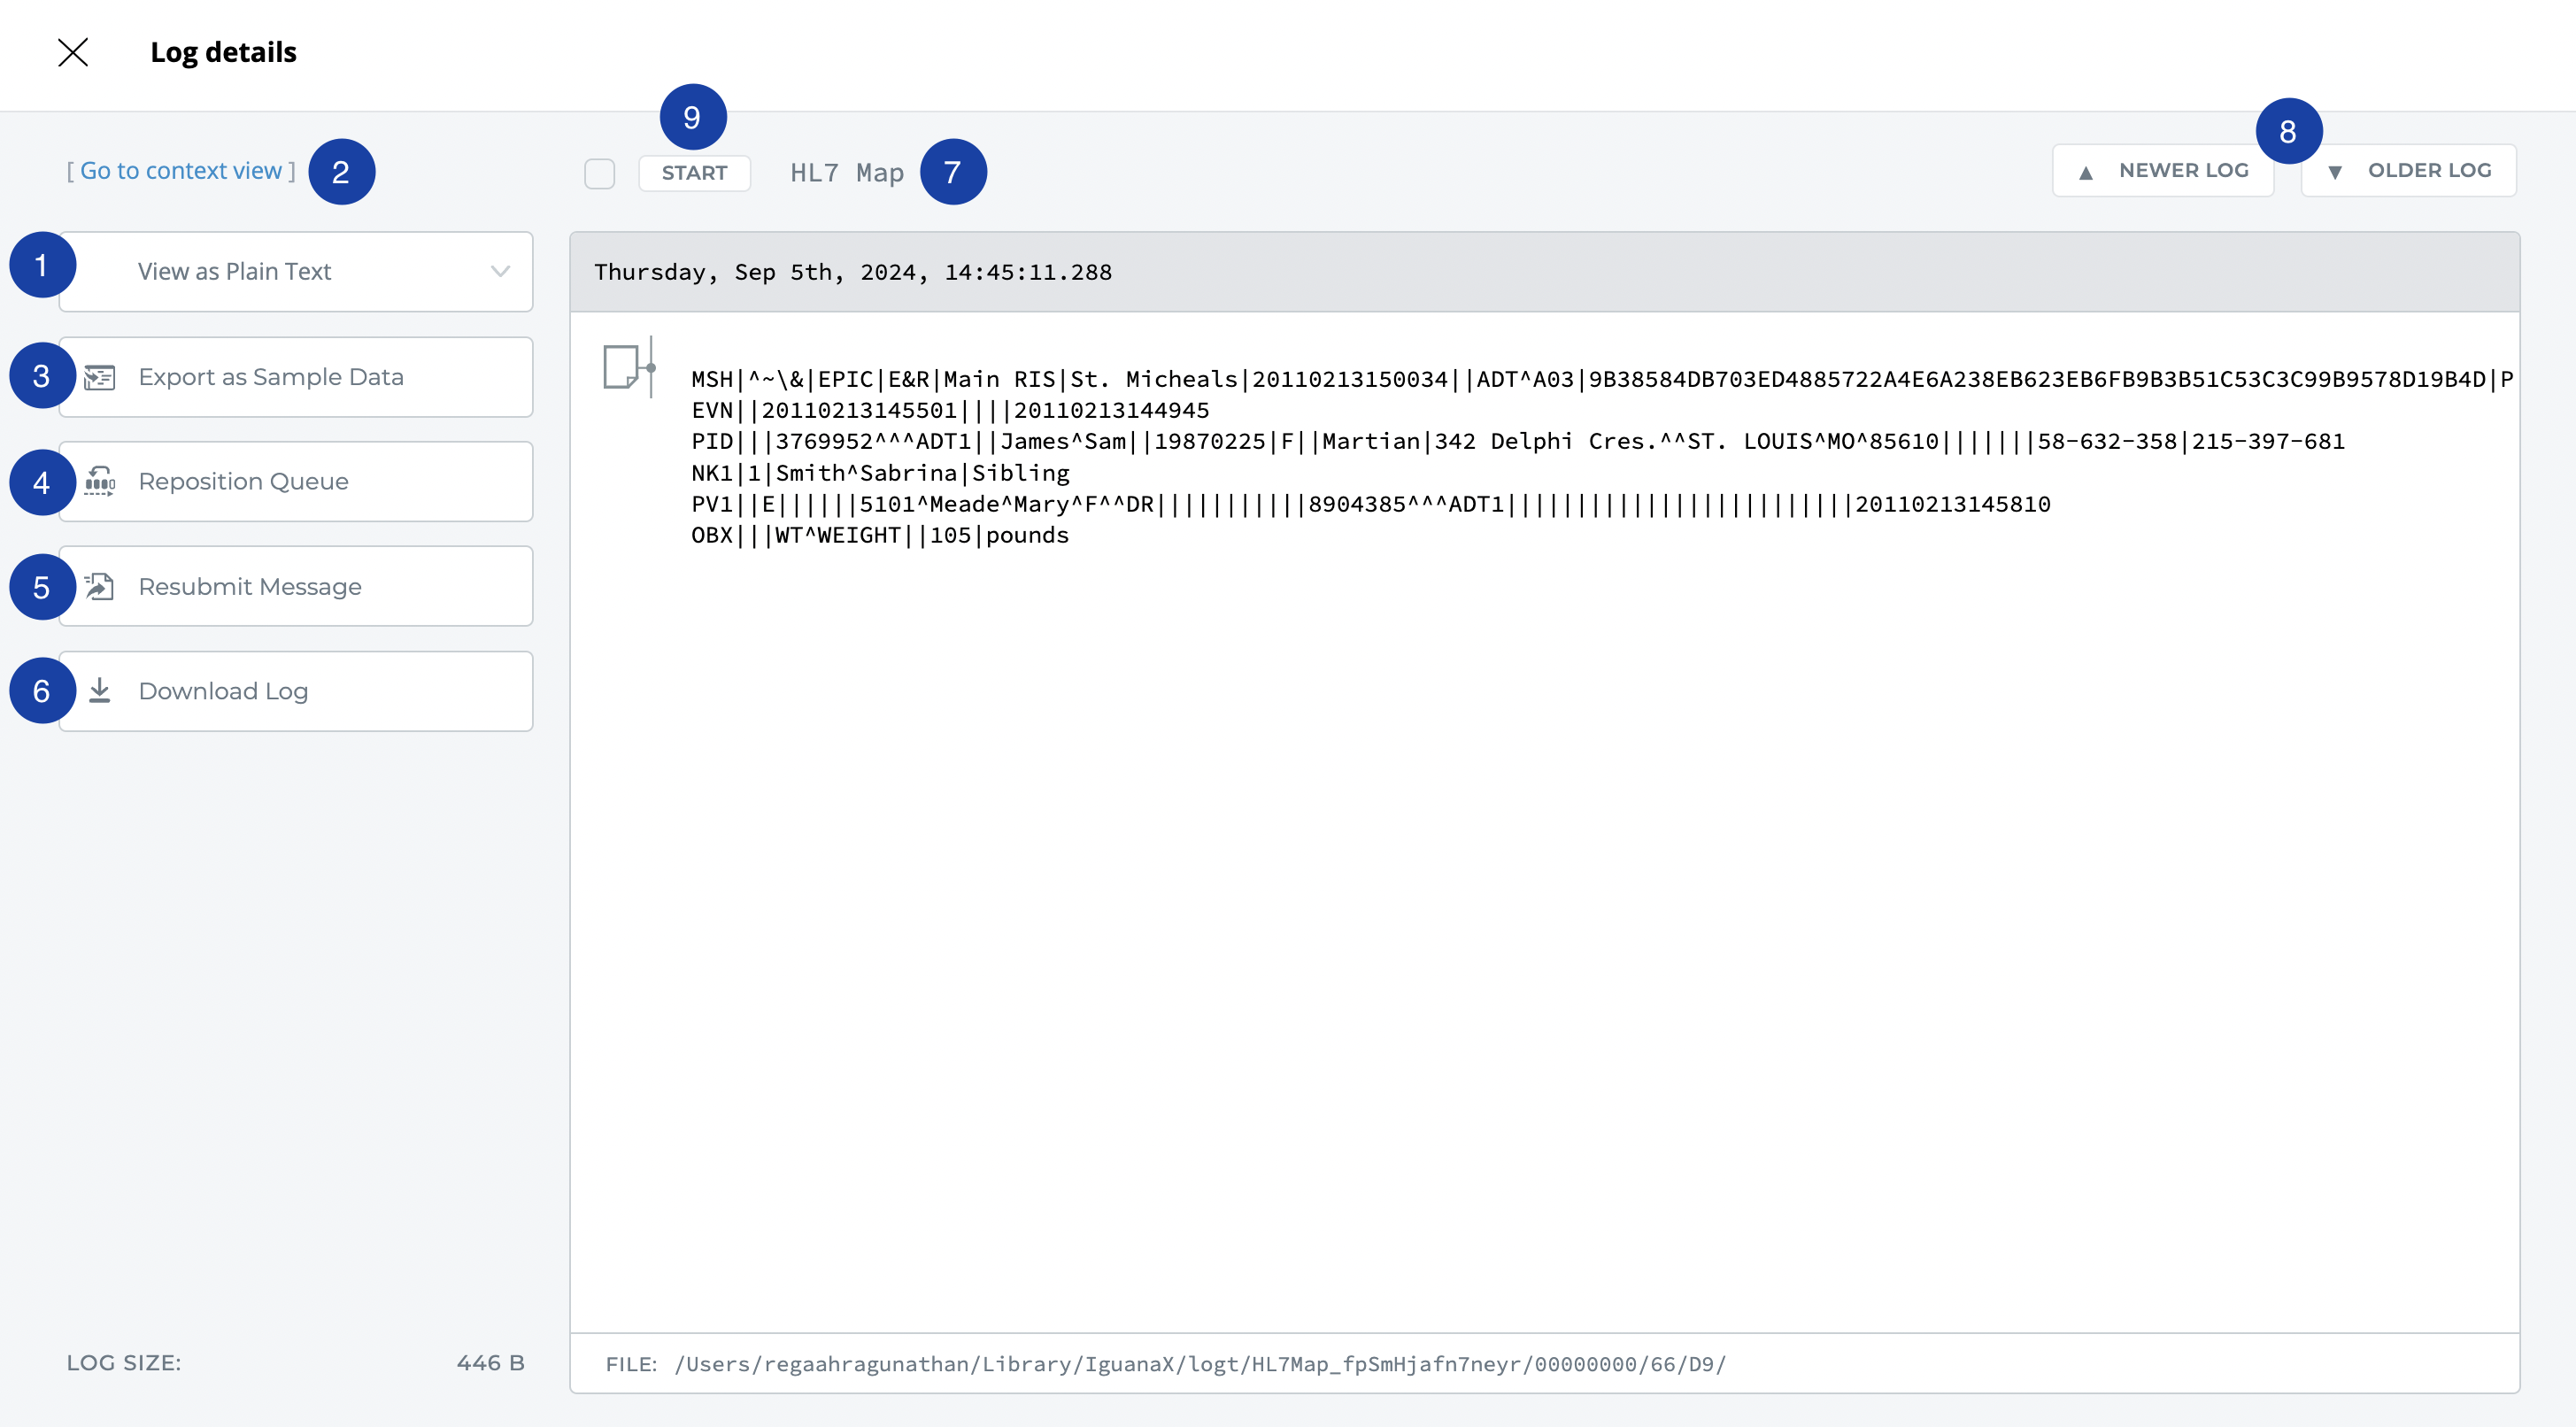
Double clicking or clicking ![]() on any message in the Logs brings you to view the Log Details of that particular message.
on any message in the Logs brings you to view the Log Details of that particular message.

1. Log View - Plain Text, Escaped, Hexadecimal
You can use the View dropdown to select how you want the log message to be expressed - in Plain Text, Escaped, or Hexadecimal.
2. Context View
View upstream and related messages of a particular log message. See Context View.
3. Export as Sample Data
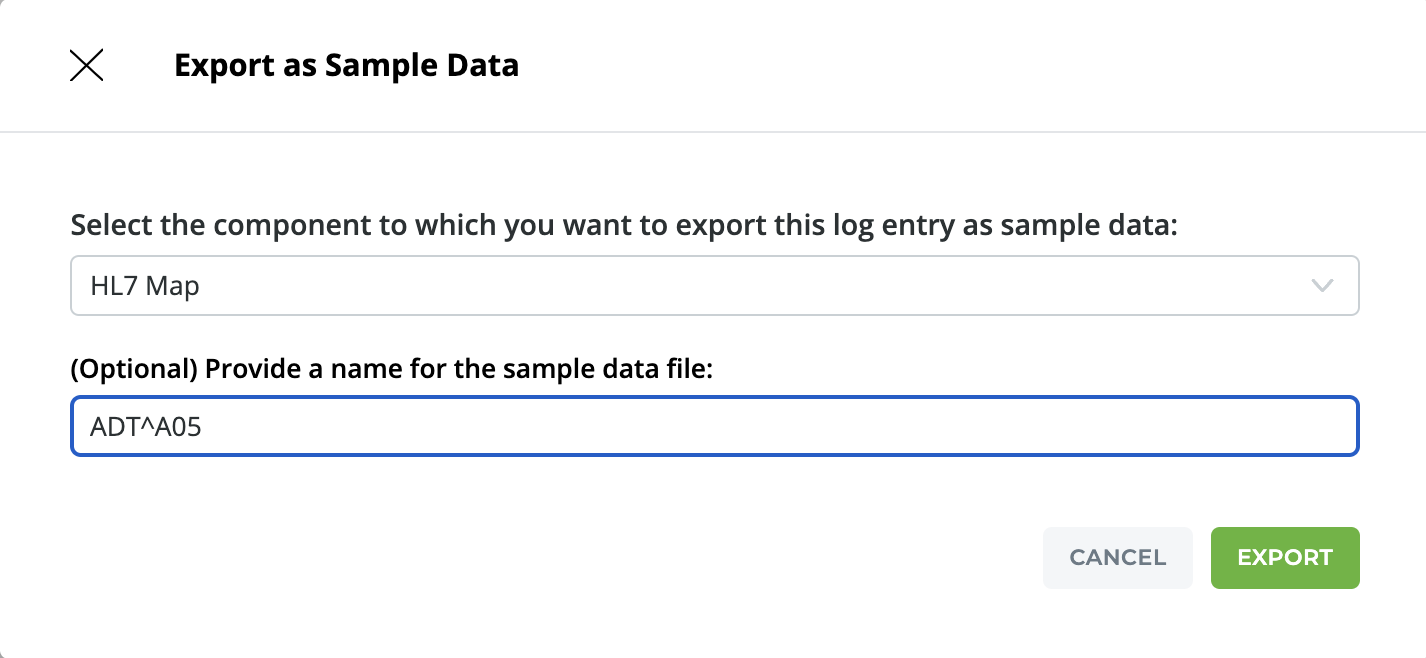
Click Export as Sample Data:
-
Use the Component dropdown to select a component to export this message as sample data.
-
Optionally, provide a name for the new sample data.
-
Click Export. You will be brought to the Component's Translator environment.

4. Reposition Queue
See Reposition a Queue for how you can reposition a component's queue from the Log Details view or the Dashboard through the Component Card.
5. Resubmit Log Message
6. Download Log
Clicking download log simply downloads the log message to the server's Downloads folder as a .log file, labelled with the component GUID.
7. Jump to the Component Card on the Dashboard
Click on the Component name to quickly navigate to the component card on the Dashboard.
8. Navigate the Log entries to view their log details using the arrow buttons
Use the navigation arrow buttons to view the next or previous log entries of a component. This navigates through all log entries, not only messages.
9. Start or Stop the Component
You can conveniently start or stop a component from the Log Details view instead of having to go back to the Dashboard or Translator.