Dashboard
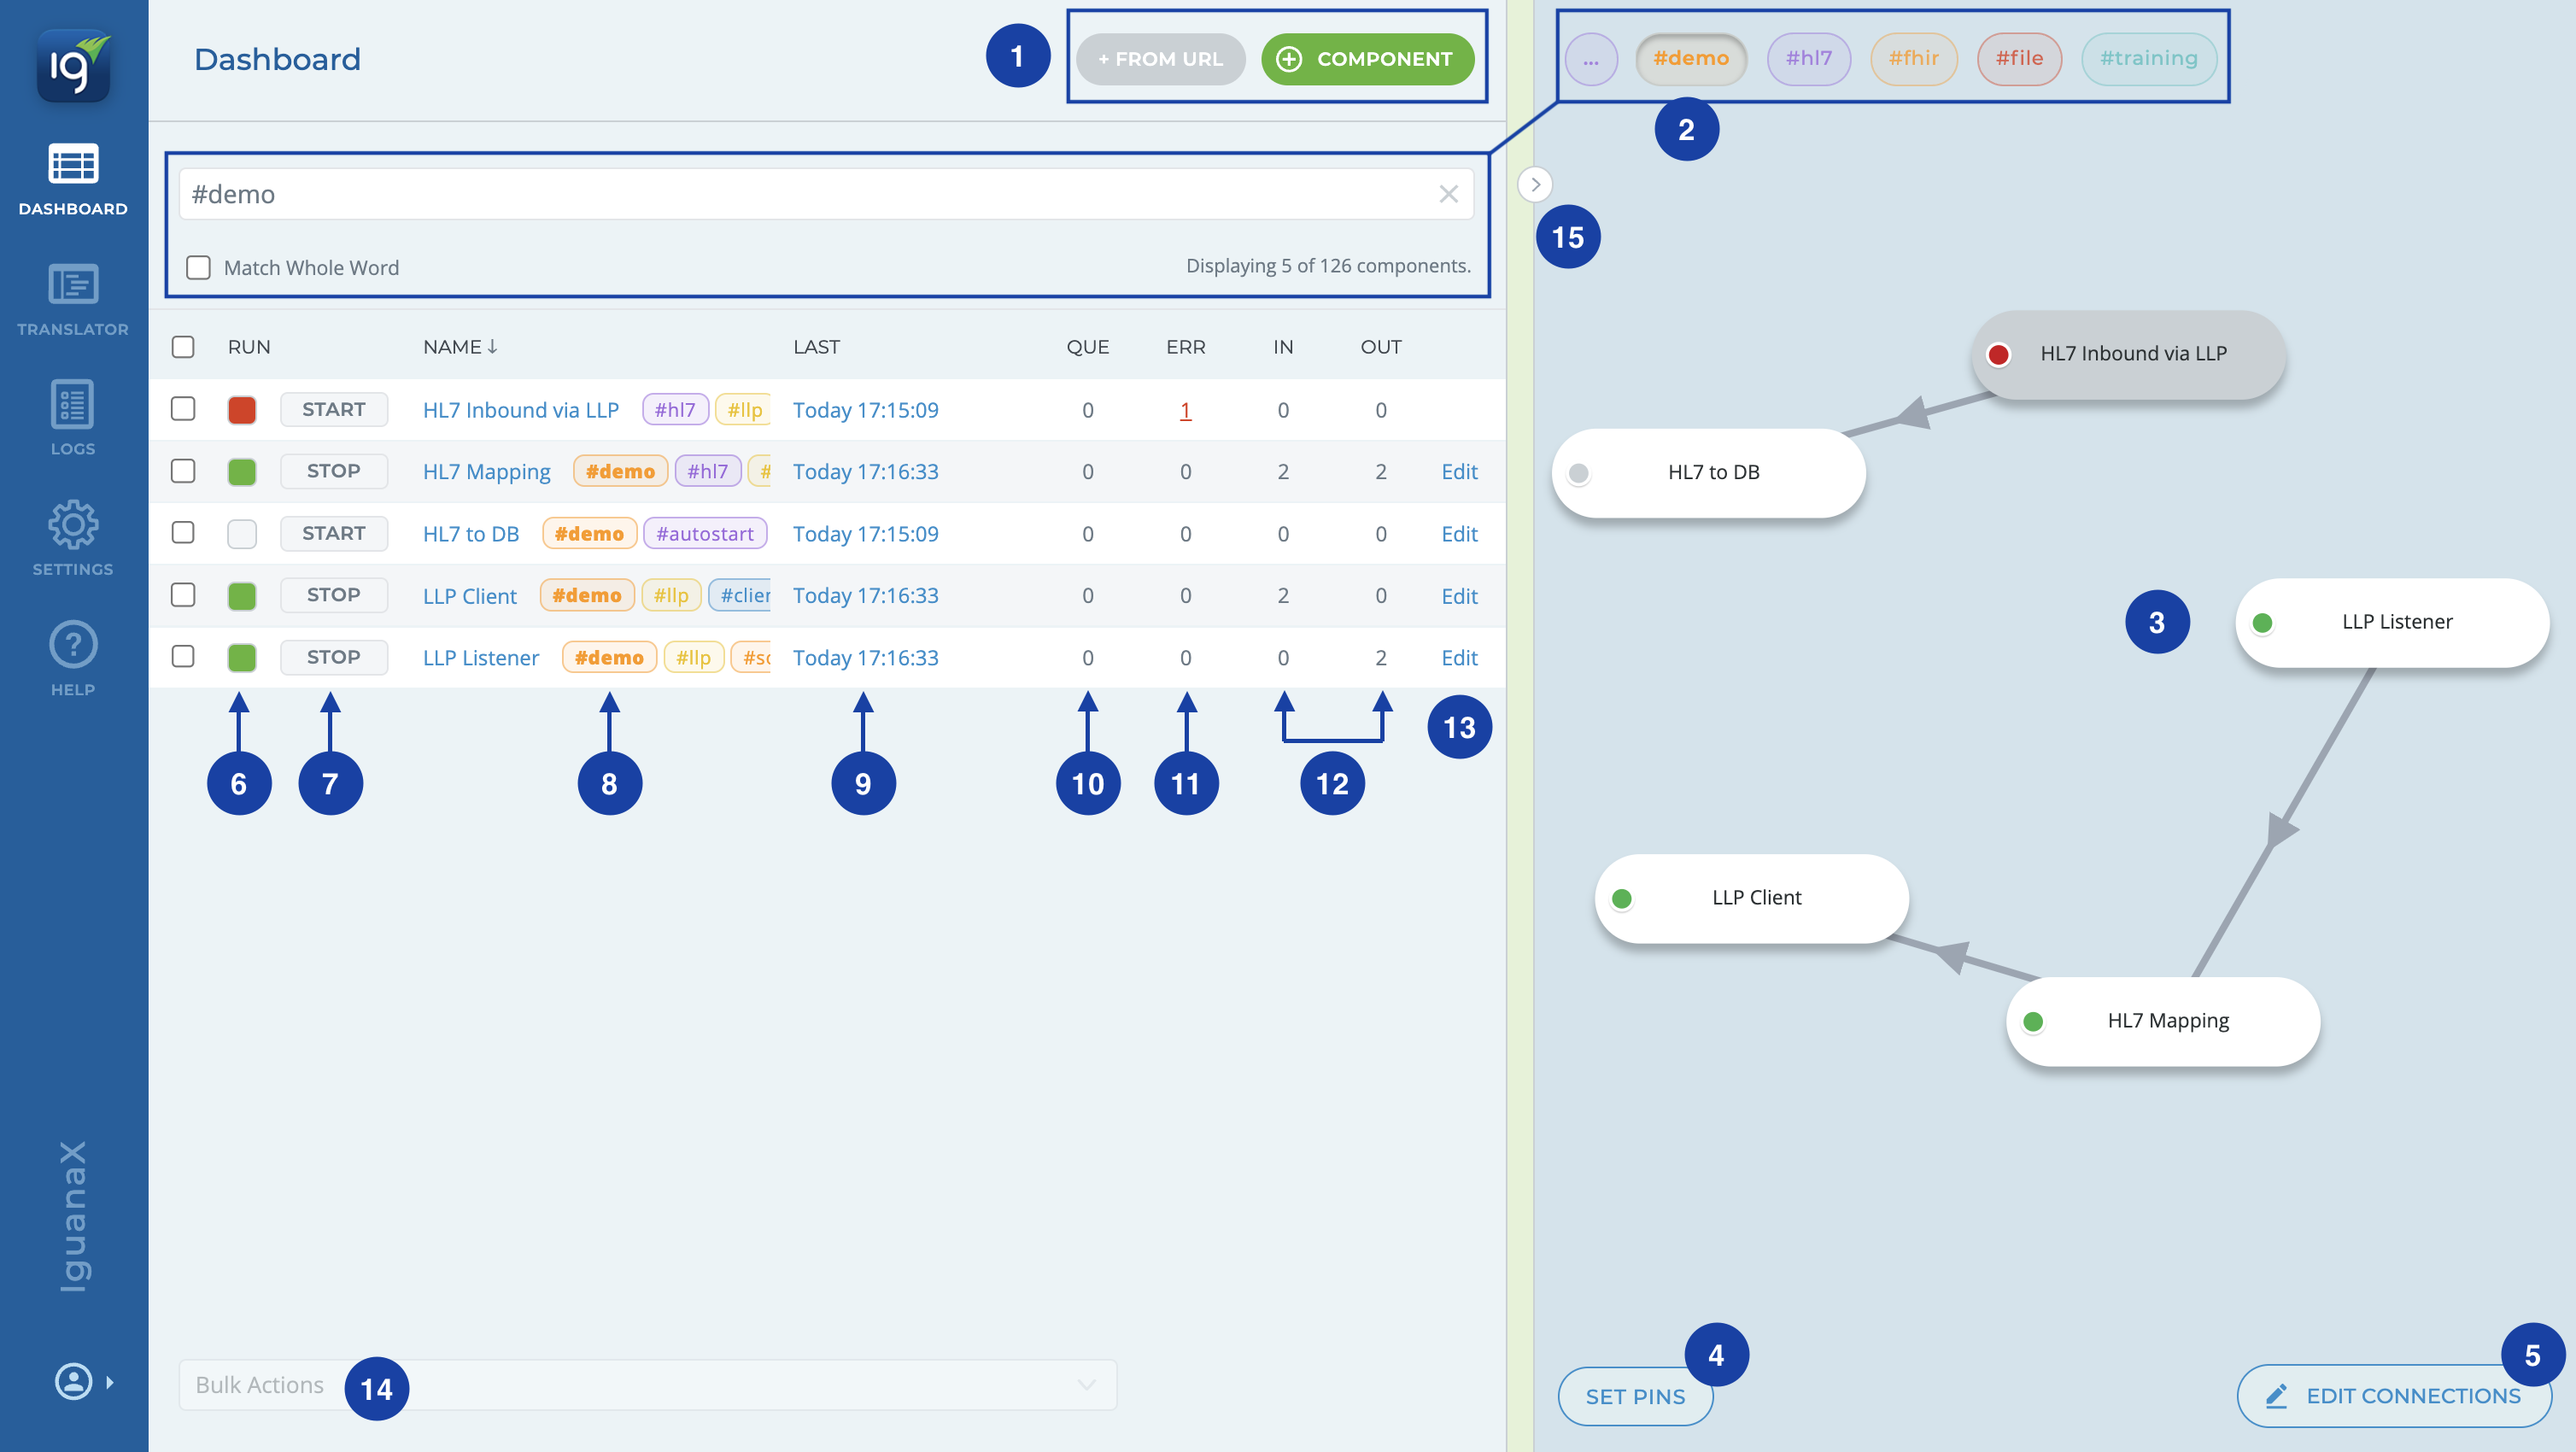
As IguanaX's control console, the Dashboard is the first place to go to get immediate insight into the health and status of your integrations. The Dashboard has several tools and metrics to give you this insight:

1. Add a Component to the Dashboard
You can add a new component to the Dashboard, using two methods:
-
 - To add a custom component or a component stored in a Git Collection. See Create a Component.
 -
 - To add a component directly from an external repository using the Git URL. See From URL.
2. Filtering Components on the Dashboard
The Dashboard has powerful filtering capabilities allowing you to quickly filter what is displayed on your Dashboard and create saved Filter Tags for regular searches. See Filtering Components on the Dashboard for how to build complex searches/filters.
3. Graphical Component View
The Dashboard displays both a list view and a graphical view of your components and the data flow, providing you a comprehensive view of how your components are linked to support your integration workflows.
4. Achoring components to a specific location
You can anchor components to a specific location on the dashboard by clicking on the set pins button in the bottom left hand corner. See Set Pins.
5. Linking and editing component connections
You can create and modify component links on the Dashboard by clicking on the edit connections button in the bottom right hand corner. See Edit Connections.
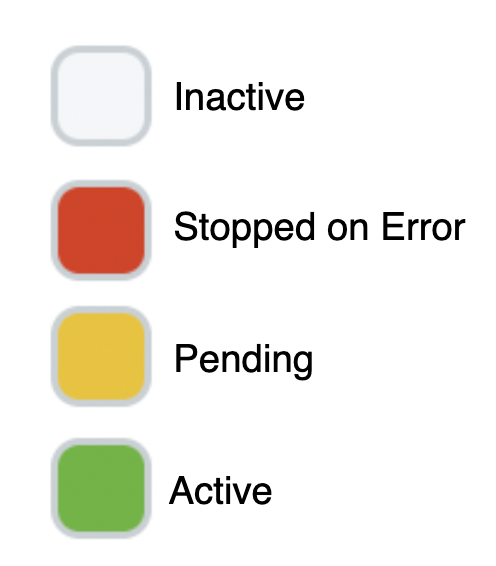
6. View the component status stoplight view
Quickly view the status of your components using the Dashboard's status stoplight view. Component's can have three status colours representing different states:

7. Control your components - Start, Stop or Kill a component
From the Dashboard, you can control the status of the component. Depending on the current status of the component you can START, STOP, or KILL a component.
You can only kill a component if it is in a pending state (yellow).
8. View Component Name and Tags
Component Names and Tags are displayed on the Dashboard.
-
By clicking on the Component Name you can open up the component card to view more configuration and activity details or enter the Translator. You can also enter the Translator directly by clicking on the Edit button at the end of the component row on the Dashboard.
-
By clicking on the Tags, you can quickly change the Dashboard to display all the components with that matching tag.
9. Last Activity
The last activity column provides you with a timestamp of the last recorded transaction for the component or “N/A” if there has been no activity since the component was last started.
These values reset when the Iguana service is restarted.
By clicking on the last activity timestamp you can jump directly to the logs of that component.
10. Component Queue Count
The component queue count is a dynamic number of unprocessed transactions remaining for the component.
You can create notifications to monitor for a queue buildup in your components. See Using Notifications.
11. Component Errors
The errors column provides you with an overview of errors and a direct link to all errors within a component.


12. Message throughput (messages in and out per second)
The IN and OUT columns provide you with dynamic message throughput per component. Throughput is measured as number of incoming and outgoing messages per second for each component.
13. Edit the component's Translator script
Quickly navigate to the component's Translator to edit the script. For Edit to be available, the component must have been made editable initially and you must have the appropriate permissions to edit component scripts.
14. Bulk Actions on components
If you need to perform bulk actions on components you can use the check boxes on the left hand side of each component to select all or multiple components. See Bulk Actions.
15. View the IguanaX instance Commit History
Click on the arrow to open the Commit History pane to display recent activity on the Iguana instance.