Datadog Heartbeat
The Datadog Heartbeat component provides a simple example of sending heartbeat logs to Datadog, where you will be able to configure Datadog alerts if the IguanaX service stops reporting, indicating a potential Iguana service issue.
STEP 1: Set up Datadog
See Datadog Setup if you are new to Datadog to find instructions for setting up a free trial with Datadog.
STEP 2: Import the Datadog Heartbeat component
Using  , import the Datadog Heartbeat component
STEP 3: Setup the component configurations in the component card
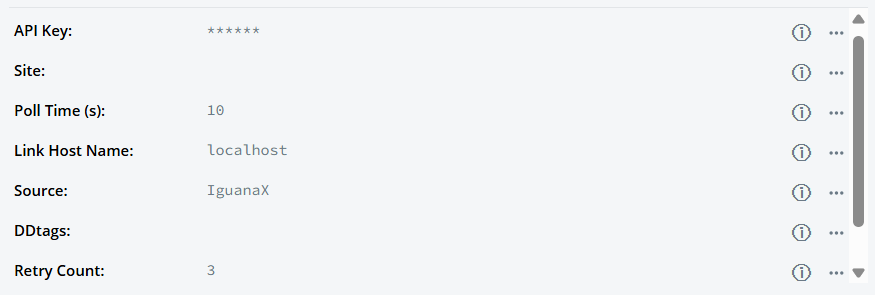

Bolded fields are required, otherwise default values defined in config.json are used:
Field | Description | Default Value |
|---|---|---|
API Key | A Datadog API key to submit events to Datadog. | |
Site | Specifies the Datadog site region. Used to construct API URLs. | |
Poll Time (s) | The frequency (in seconds) the component polls. |
|
Link Host Name | Host name of the Iguana instance. |
|
Source | The source application sending logs. |
|
DDtags | Tags associated with logs to be sent. Multiple tags are delimited by commas. | |
Retry Count | Number of send attempts to Datadog. |
|
Retry Pause (s) | Length of pause between sending attempts in seconds. |
|
Notes & Recommendations:
-
Use a short polling interval for critical instances.
-
To identify which Datadog site you are using, please see https://docs.datadoghq.com/getting_started/site/
-
For DDtags, tags are delimited by commas, e.g. “tag1, tag2, tag3” or “tag1,tag2,tag3”.
STEP 4: Start the component
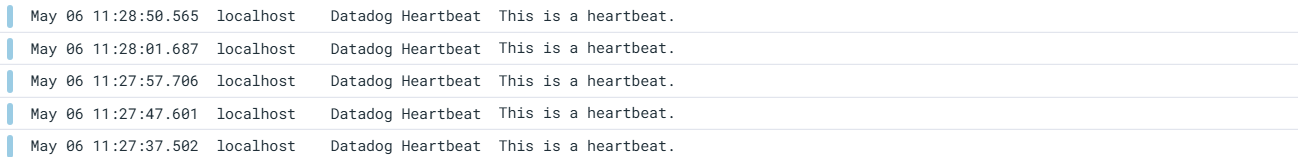
Once the component is started, a heartbeat will be continuously sent to Datadog logs based on the configured poll time.
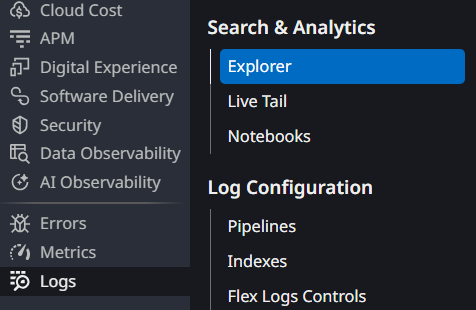
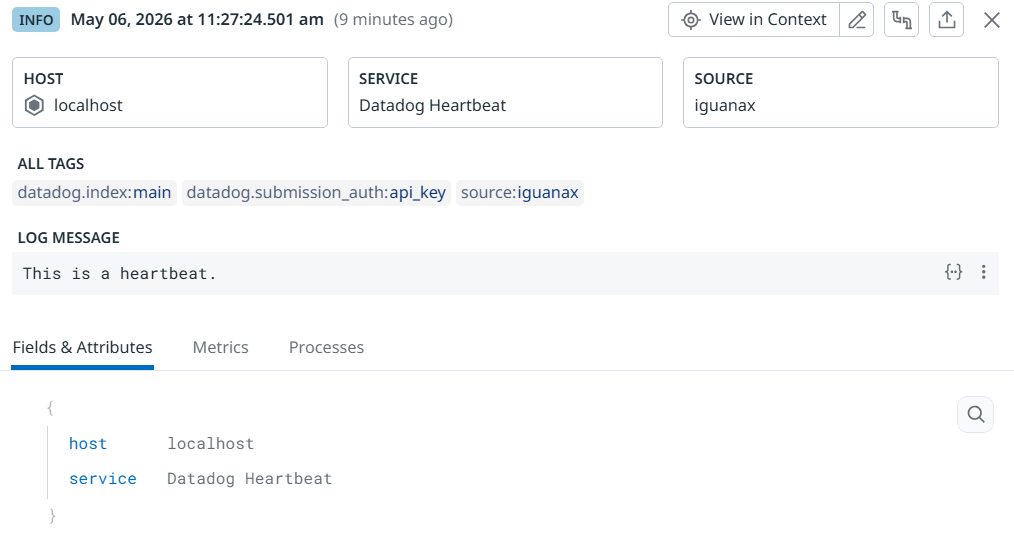
You can confirm successful delivery by viewing the logs in Datadog's Log Explorer:
Example heartbeat logs:
Example expanded heartbeat logs:
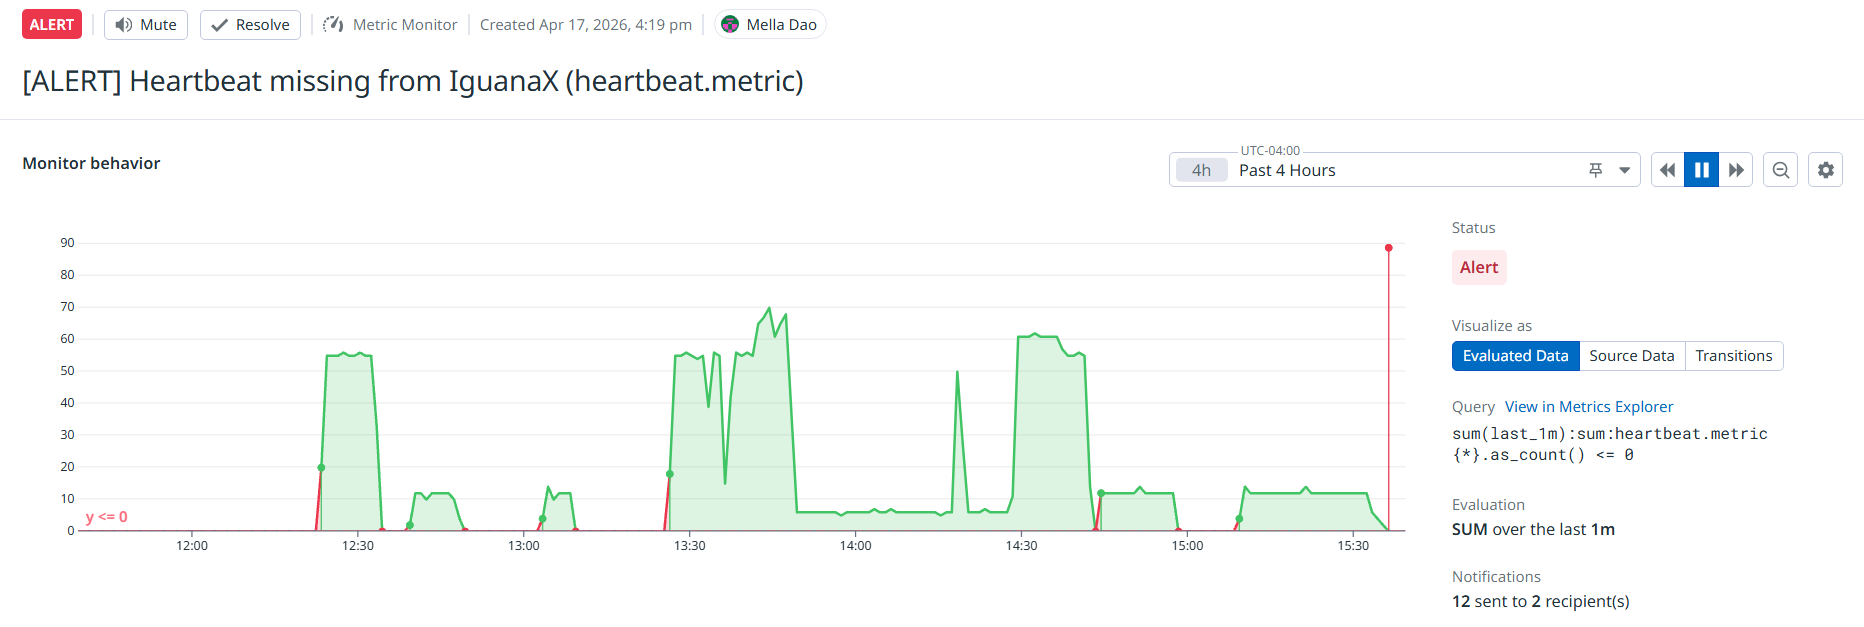
Configuring Datadog Alerts
Once the Datadog Heartbeat component is set up, you'll need to set up Datadog alerts to look for missing data - in other words the Iguana service being down.
STEP 1: Create a new Metric
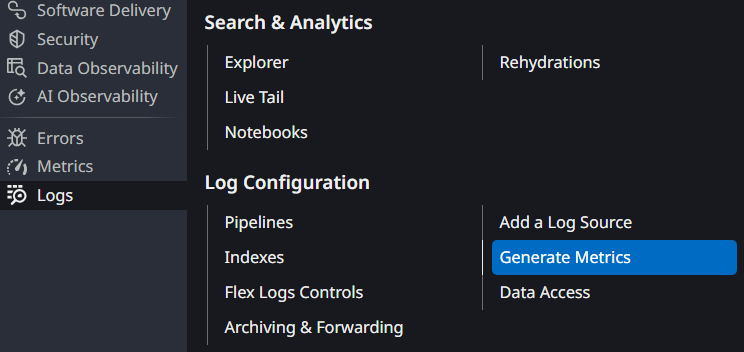
On Datadog, hover over the “Logs” tab and click on “Generate Metrics”.
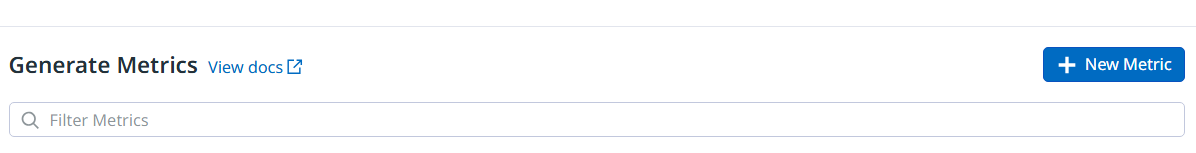
Create a new metric by clicking “+ New Metric”:
Give your new metric a name and set the query to “host:*”:
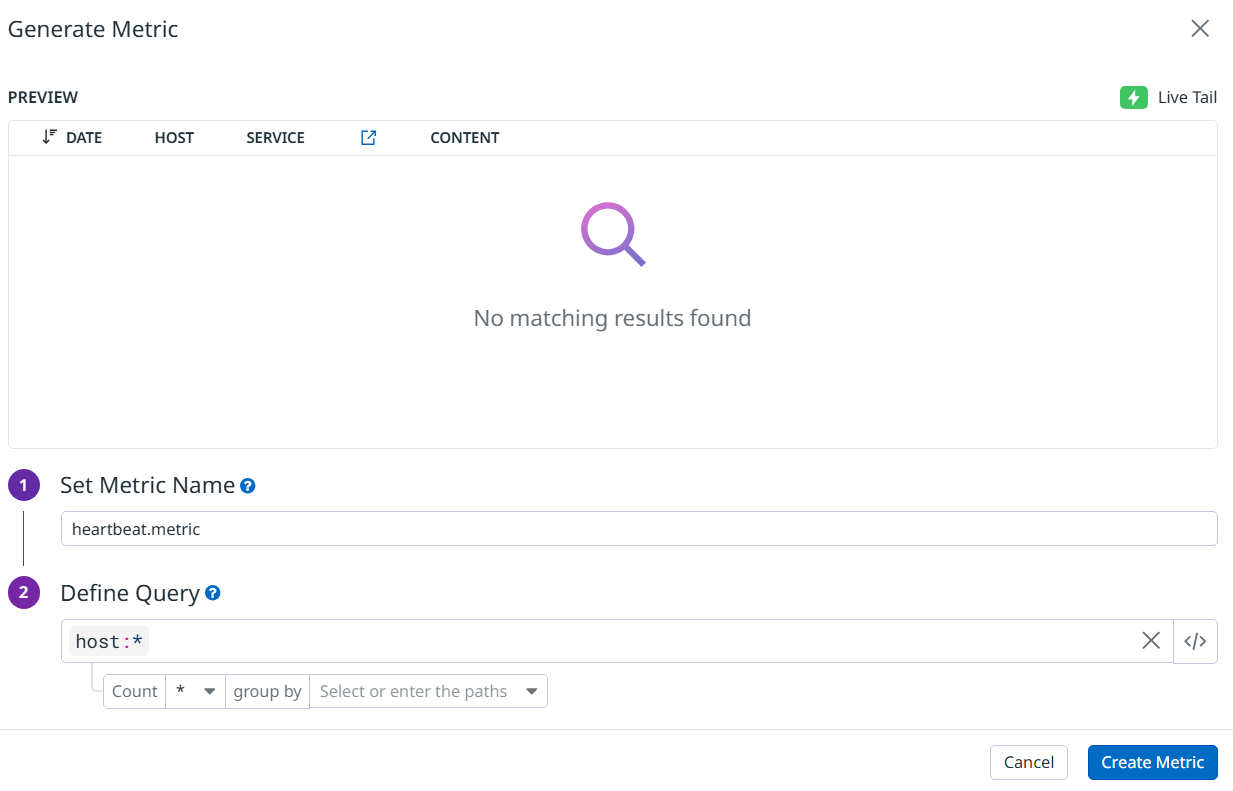
Click “Create Metric” to finish creating the metric.
STEP 2: Create a new Monitor
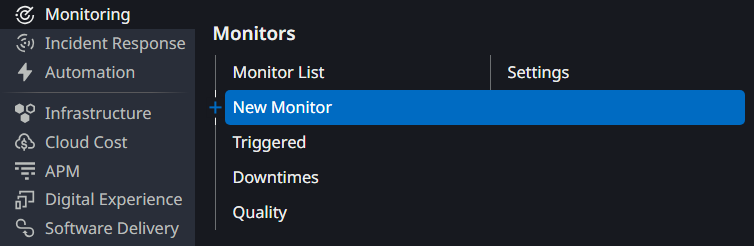
Hover over the “Monitoring” tab and click “New Monitor” to create a new monitor.
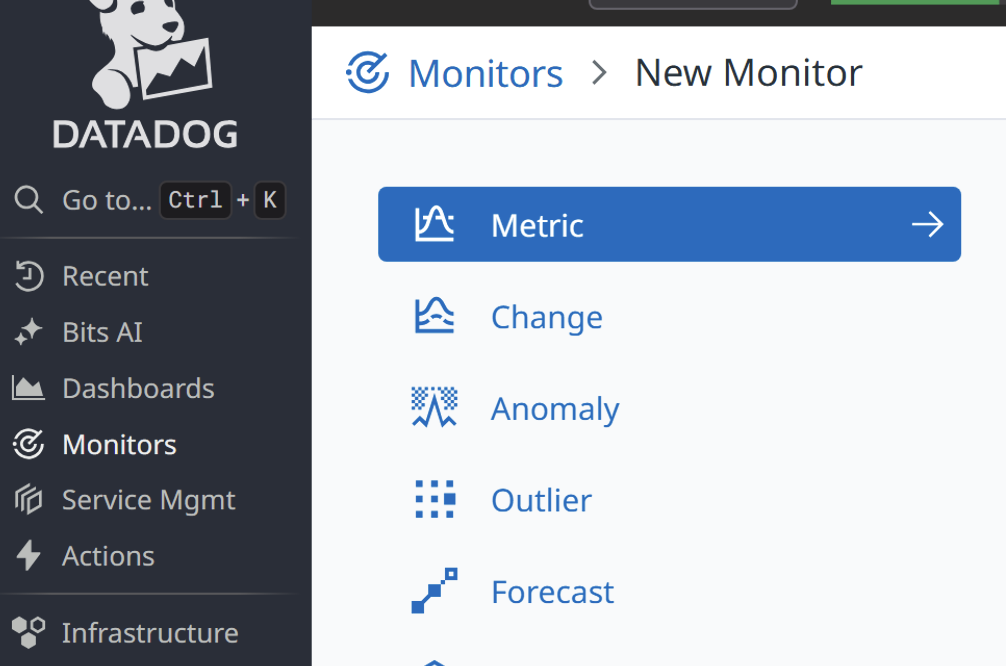
Select “Metric”:
STEP 3: Configure the new Monitor
To configure the new monitor for the heartbeat check, choose “Threshold Alert” in step 1. Define the metric as “heartbeat.metric” and configure the alert conditions as shown below:
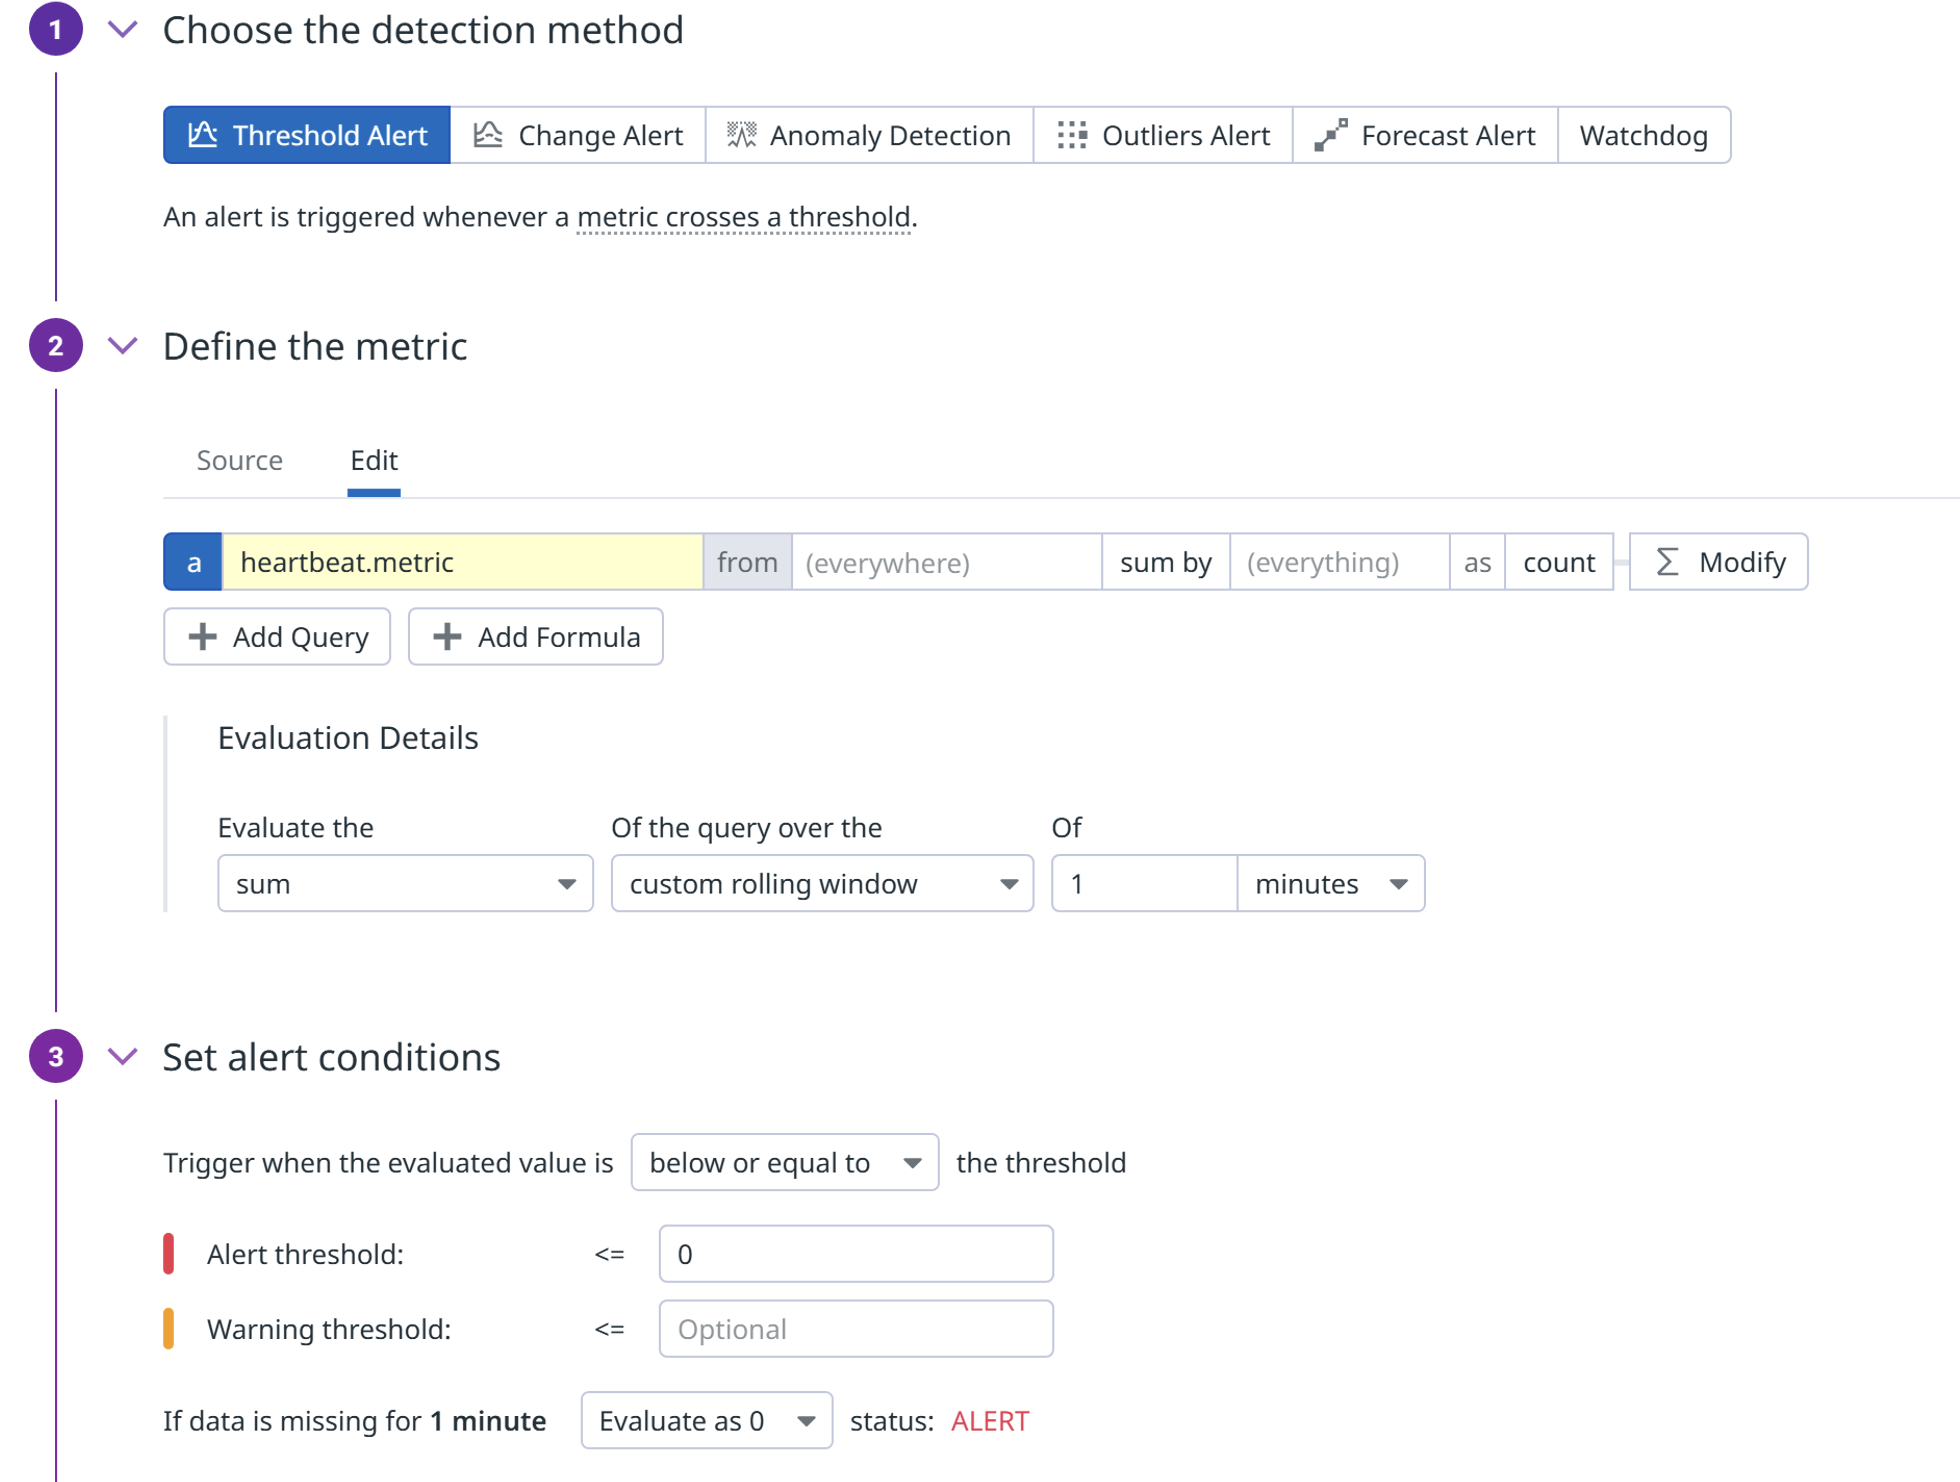
This monitor will trigger an alert if there was no data sent to Datadog within the last one minute. Change the custom rolling window under Evaluation Details to change the time value.
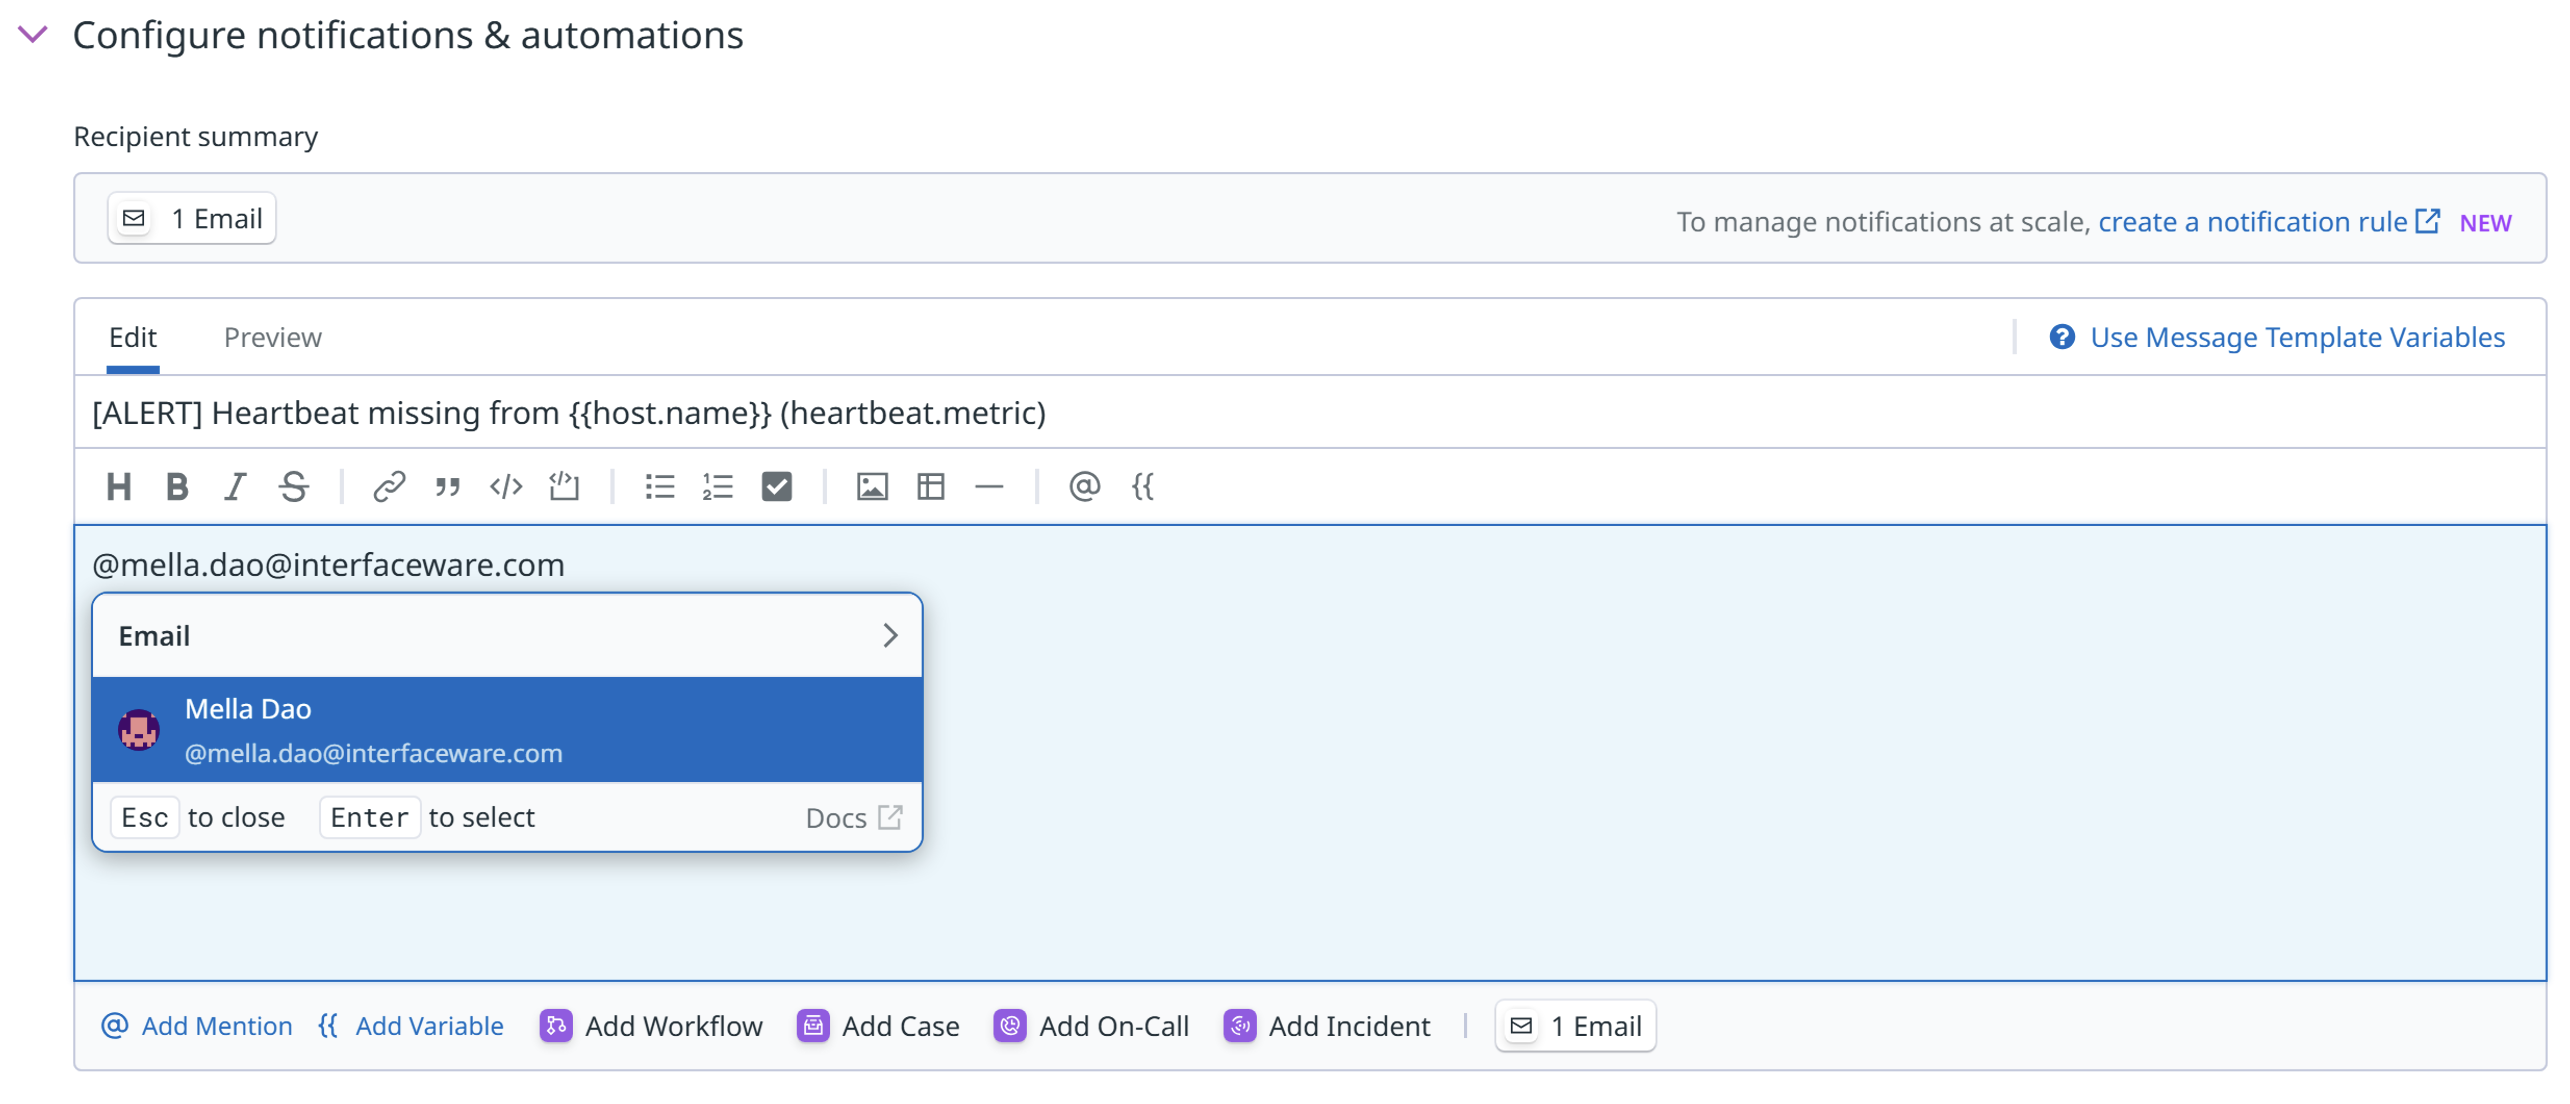
STEP 4: Configure Datadog notifications
Configure a custom notification email to be sent out when the monitor is triggered. You will be able to tag yourself or other recipients within the email.
STEP 5: Test the Alert
Test the alert by stopping the Datadog Heartbeat component for at least one minute to trigger a Datadog alert or however long according to the metric evaluation and alert rules configured in step 3.