Datadog Sender
The Datadog Sender component is designed to work with the Notifications System and Notifier Receiver component to send logs to Datadog for further processing. These components have two distinct roles, which allows us to build a reliable notification system. The Datadog Sender handles the actual delivery and ensures sending problems won't impact the Notifier Receiver. It is designed to receive individual logs or multi-logs data from Notifier Receiver in the queue to process and send to Datadog.
STEP 1: Set up Datadog
See Datadog Setup if you are new to Datadog to find instructions for setting up a free trial with Datadog.
STEP 2: Import the Notifier Receiver and Datadog Sender components
Using +COMPONENT, import two components:
-
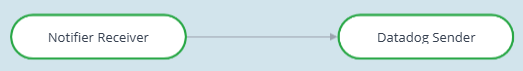
Notifier Receiver
-
Datadog Sender
You will need to Edit Connections to link these two components together:
STEP 3: Setup the component configurations in the Datadog Sender component card
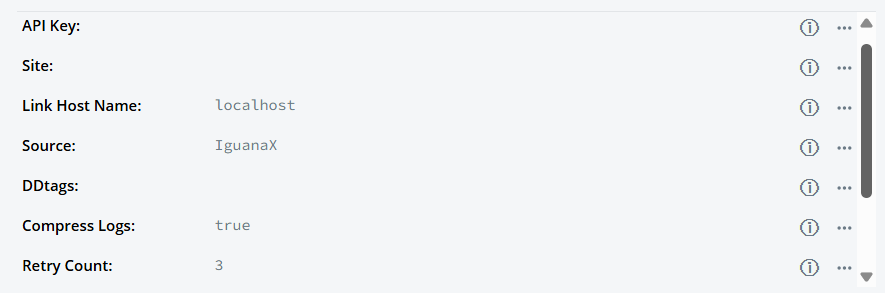
Bolded fields are required, otherwise default values defined in config.json are used:
Field | Description | Default Value |
|---|---|---|
API Key | A Datadog API key to submit events to Datadog. | |
Site | Specifies the Datadog site region. Used to construct API and log intake URLs. | |
Link Host Name | Host name of the Iguana instance. |
|
Source | The source application sending logs. |
|
DDtags | Tags associated with logs to be sent. Multiple tags are delimited by commas. | |
Compress Logs | Choose whether to compress logs before sending to Datadog. |
|
Retry Count | Number of send attempts to Datadog. |
|
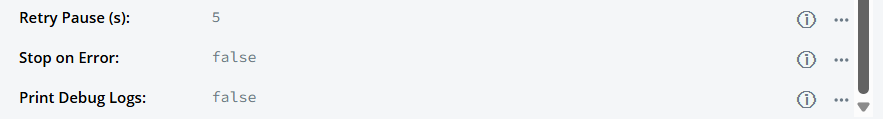
Retry Pause (s) | Length of pause between sending attempts in seconds. |
|
Stop on Error | Configure component to stop on error or continue running. |
|
Print Debug Logs | Enable/disable logging of additional debug information. |
|
Notes & Recommendations:
-
To identify which Datadog site you are using, please see https://docs.datadoghq.com/getting_started/site/
-
For DDtags, tags are delimited by commas, e.g. “tag1, tag2, tag3” or “tag1,tag2,tag3”.
STEP 4: Start the component
Once the component starts, available logs in the component queue will be sent to Datadog. For multi-log requests, each log within the request will appear as separate entries in Datadog's Log Explorer.
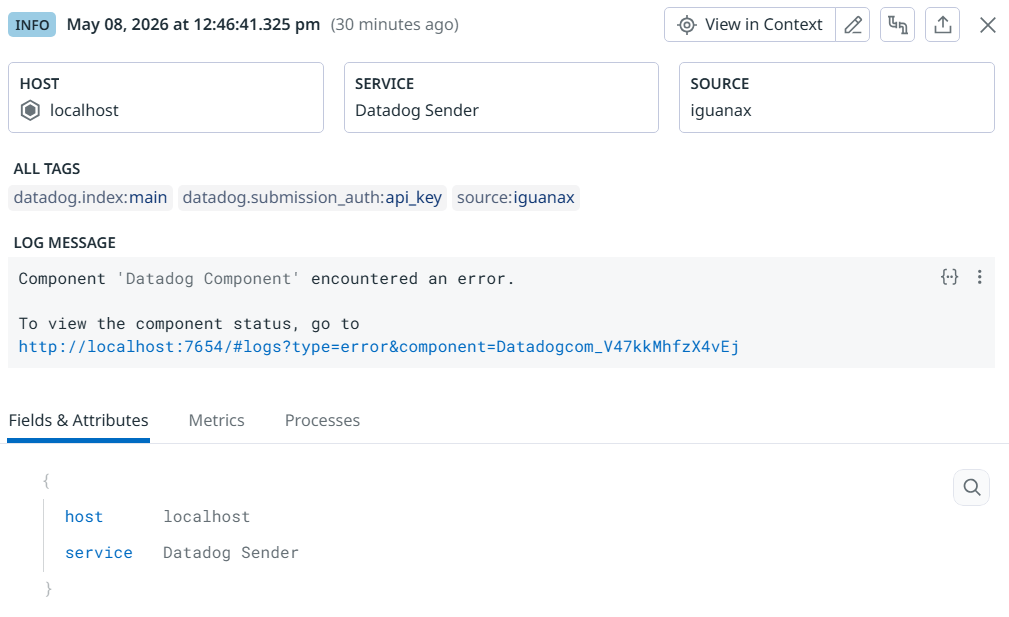
You can confirm successful delivery by viewing the logs in Datadog's Log Explorer:
Example logs:

Example expanded log:
Configuring Datadog Alerts
Here is a simple example on how to configure alerts when Datadog receives a log containing “encountered an error” that needs to be treated as a high priority and send out email alerts.
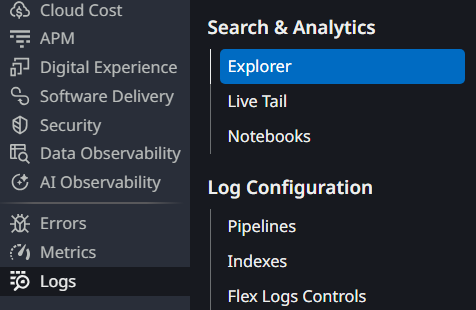
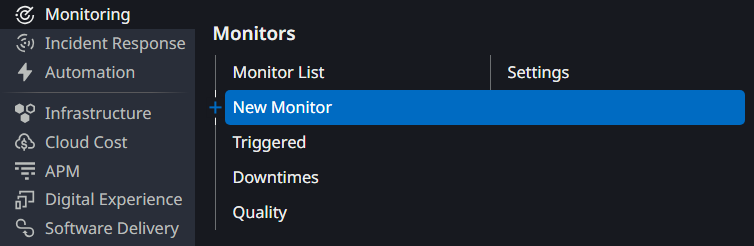
STEP 1: Create a new Logs Monitor
Hover over the “Monitoring” tab and click “New Monitor” to create a new monitor.
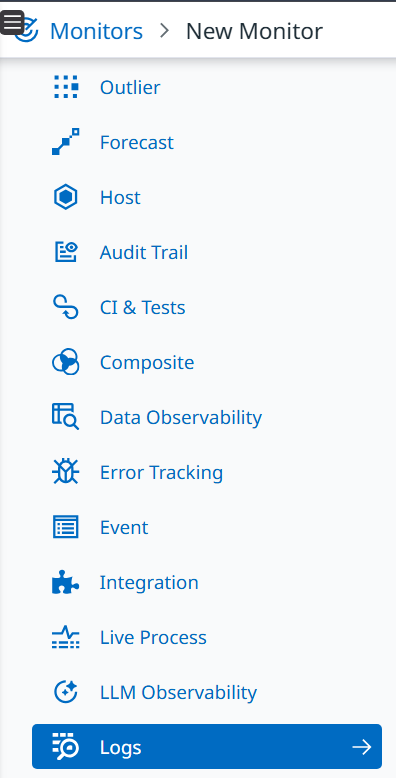
Select “Logs”:
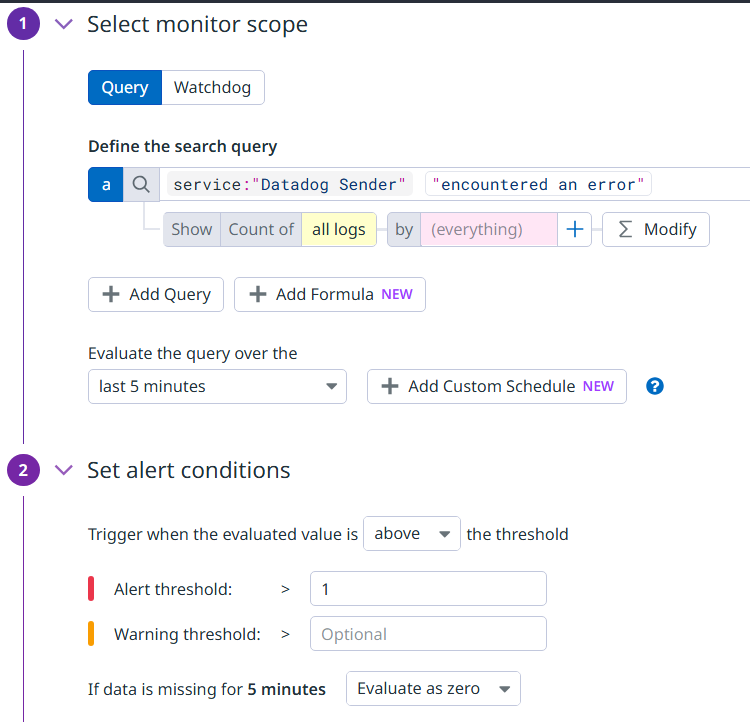
STEP 2: Configure the new Logs Monitor
To configure the new logs monitor, define the search query and alert conditions:
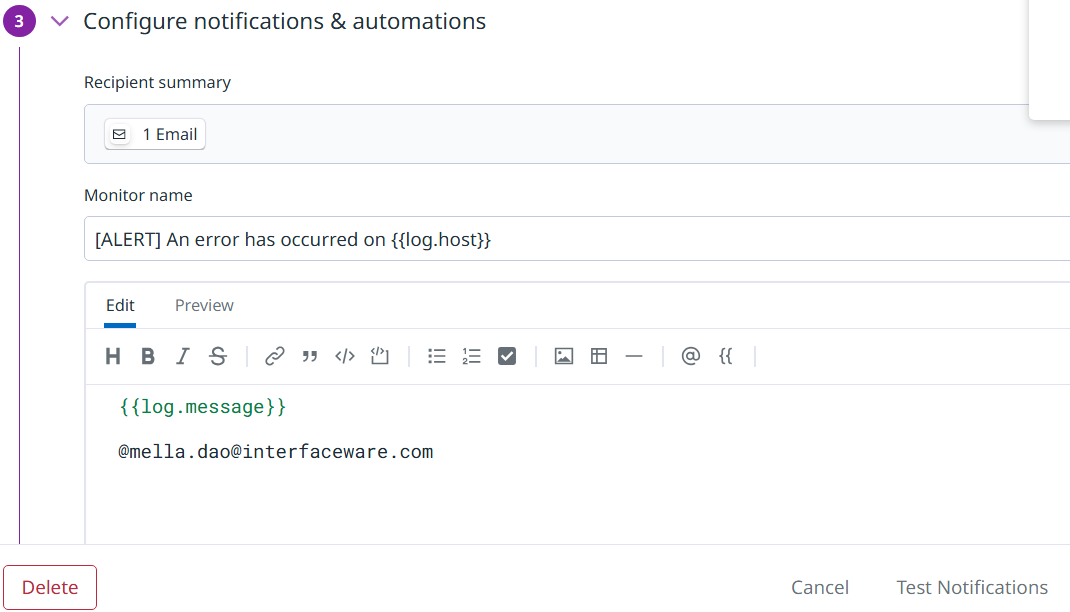
STEP 3: Configure Datadog notifications
Configure a custom notification email to be sent out when the monitor is triggered. You will be able to tag yourself or other recipients within the email. You will also be able to trigger a test notification by clicking “Test Notifications” at the bottom.
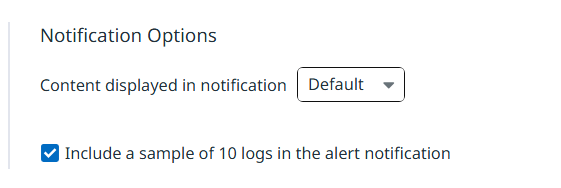
You can also configure the notification to include log samples in the alert. Please exercise caution enabling this if PHI will be in the logs.
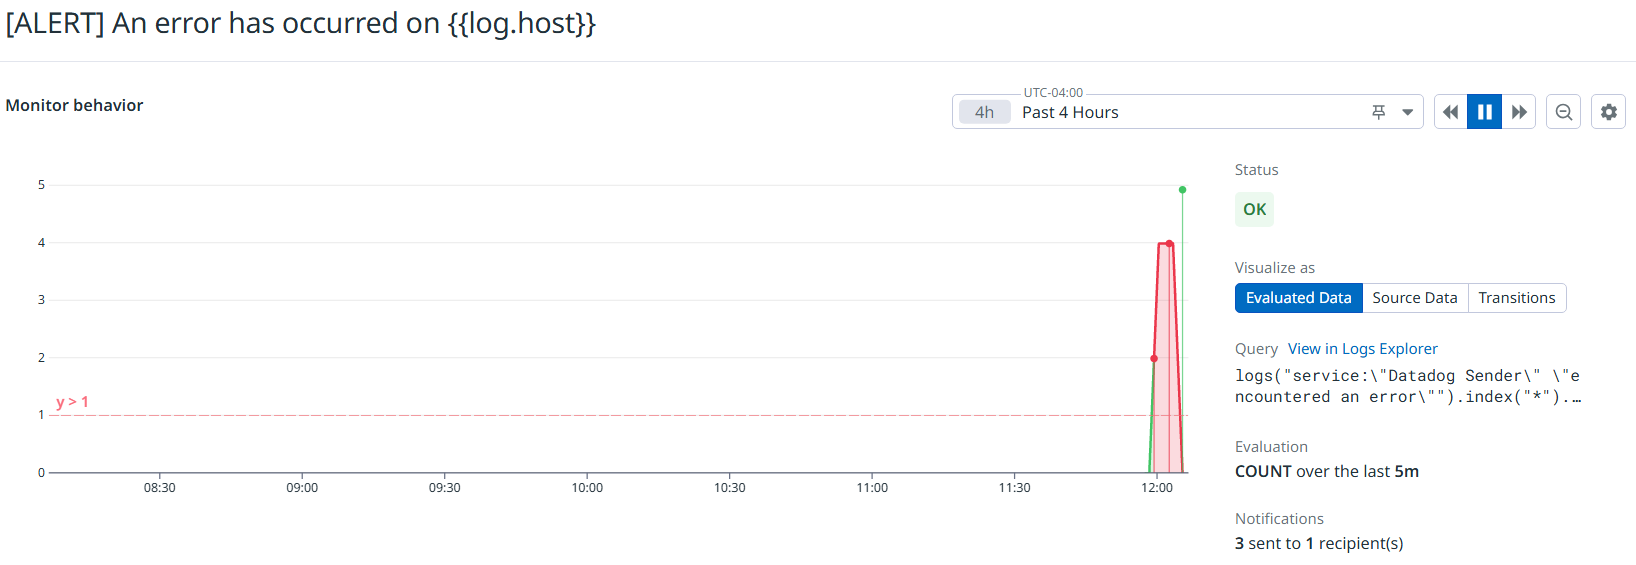
STEP 4: Test the Alert
Test your custom alert by sending a log from IguanaX to Datadog that fits the defined search query.
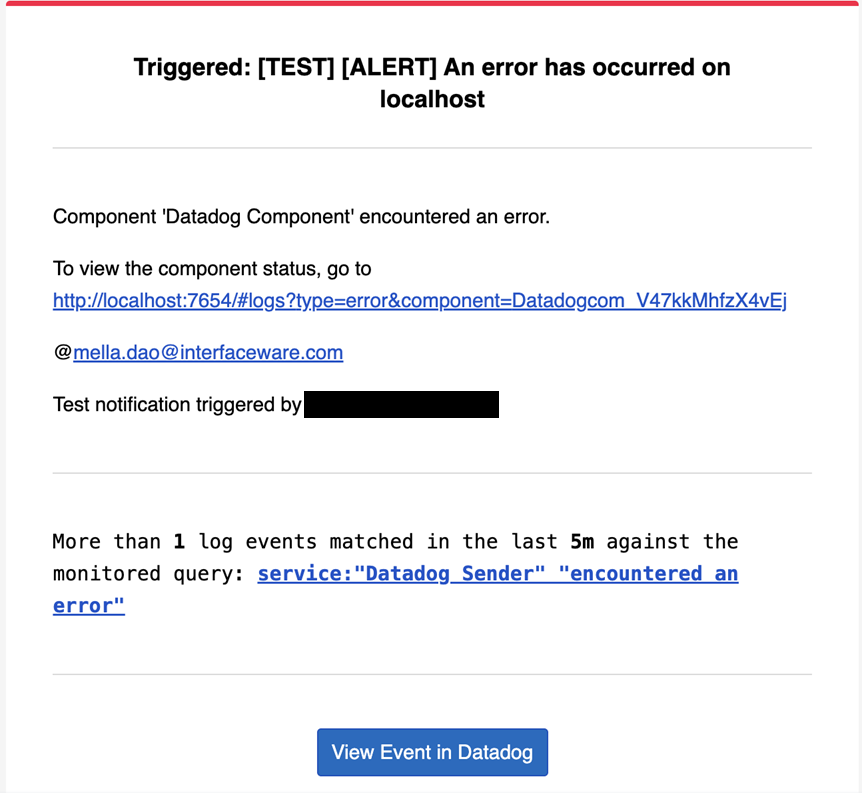
For example, if you defined the search query following the example in step 2, the monitor will trigger an alert if there was a log sent to Datadog with content “encountered an error”. If no new logs matching the search query are sent to Datadog over the next 5 minutes, Datadog sets the status to “OK” and sends a subsequent notification email to inform that it has recovered.
Example email: